Archive for December, 2006

Pictures While I Vacation

Sunday, December 24th, 2006

I’ll be posting irregularly over the next week+, and may be slow in checking your comments. Some pictures of places I love in California:

Muir Woods
Muir Woods

Sea Lions at Big Sur — a 5-day bicycle trip from Berkeley. Sea lions often kept me company on the road south; I heard their barking for days.
Sea Lions at Big Sur

Samuel Taylor State — a nearby destination for a bicyclist, or a stopover going north.
Samuel Taylor State Park

California (and everywhere else?) has hike and bike campsites. Anyone who arrives by foot or bicycle can camp for $3 – 5.

Have you hiked or biked to or in a place of beauty? Include a picture in your comment.

Energy Incentives

Wednesday, December 20th, 2006

How do energy incentives compare?

The spring Issues Online examines the various types of energy subsidies.

Tax policy creates the largest transfer of money to energy companies:

Energy Incentive by Type

Oil companies have been the beneficiary of almost half of all incentives:

Energy Incentive by Energy Source

Since 1976, when energy policy decisions became less haphazard, the two largest recipients of research and development funds have been photovoltaics (solar panels) and solar thermal (heating water, or concentrating the sun’s rays for a conventional power plant):

Federal R&D 1976 - 2003
LEGEND: PV: Photovoltaic (renewable); ST: Solar Thermal (renewable); ANS: Advanced Nuclear Systems; CS: Combustion Systems (coal); AR&T: Advanced Research and Technology (coal);LWR: Light Water Reactor (nuclear); Mag: Magnetohydrodynamics (coal); Wind: Wind Energy Systems (renewable); ARP: Advanced Radioisotope Power Systems (nuclear).

Another article by the same authors looks at how the US spent $644 billion (2003 dollars) in energy subsidies between 1950 and 2003.

The link to post an image of the table isn’t working, so here are the large numbers:

  • Nuclear — $61 billion incentives in R&D, $10 billion regulation, and -$8.3 billion in disbursements. (see below, Price-Anderson) Total: $63 billion
  • Hydro — $54 billion in market activity, and $15 billion in regulation and taxation. Total $73 billion
  • Coal — $27 billion in R&D, $33 billion in regulation and taxation, $13 billion in government services. Total: $81 billion
  • Oil — $155 in taxation, $106 billion in regulation, $27 billion in government services. Total $302 billion
  • Natural Gas — $76 billion in taxation, $6 billion R&D. Total: $87 billion
  • Solar — $16 billion in R&D, $12 billion taxes. Total: $33 billion
  • Geothermal — $3 billion R&D, $1.4 billion each in taxation and market activity. Total: $5.7 billion
  • The disbursement of -$8.3 billion for nuclear energy comes from the tenth of a cent/kWh paid for nuclear power into the nuclear waste fund.

    Price-Anderson Act

    The Price-Anderson Act requires the nuclear industry to obtain maximum insurance ($300 million/plant), and to be able to contribute up to $96 million for more expensive accidents at any US nuclear power plant. Any expenses in a nuclear accident above $10 billion would be paid by the federal government. As of now, $151 million have been paid for industry claims ($70 million for Three Mile Island, and the rest?)

    More on the history of the Price-Anderson Act.

    Thanks to the NEI blog for the link and extra information.

    Making subsidies fair

    It is not important that energy incentives be fair, but that we get good energy policy for our money. Solar power, both photovoltaic and solar thermal, require more R&D and direct purchase subsidy than does wind. This is important as solar is expected to be an important part of energy supply in the future, though it will be many decades before solar power will provide more than 20% of our electricity. Even though wind power provides significantly more electricity, it doesn’t require the same subsidy as PV. Fair is what helps us, today and tomorrow. Some of the investment in coal power R&D makes sense. Hopefully, another analysis will examine where our subsidy policy, with its emphasis on tax breaks for oil, makes sense, and where it should be changed.

    It’s 47 F in Moscow

    Wednesday, December 20th, 2006

    We’re shivering in Berkeley with somewhat higher temperatures, but the people in Moscow and much of the rest of Europe are confused. As are some other species.

    Many Muscovites find they cannot use their sleds, while new leaves are sprouting on trees in Switzerland.

    But mean temperatures in parts of Europe has been increasing for some time.

    Winter temperatures in central England
    Source RealClimate

    Hardiness Zones Shift

    Tuesday, December 19th, 2006

    Hardiness zones are geographic areas with the same range of low temperatures, say 30 – 40 F, well, most winters it never gets below freezing here in Berkeley.

    The National Arbor Day Foundation has posted a map showing the shift of hardiness zones between 1990 and 2006, and another showing how many zones your area has changed in that time.

    Thanks to We Support Lee for the pointer.

    Have you been noticing differences in minimum temperatures in that time?

    Here in Berkeley, the warm September/October winds blow in October/November, but minimum temperatures seem to be the same.

    Saving Energy at Home

    Monday, December 18th, 2006

    Reducing energy use in the world will require mandates, but it will also require billions of individual good decisions. Links to help reduce the work in doing good:

    â—¦ Home Energy Saver
    â—¦ Energy-Saving Resources–Home
    â—¦ Energy Star energy efficient appliances, home improvements, and building design
    â—¦ Choosing Energy Efficient Products
    â—¦ Energy Efficient Windows
    â—¦ Consumer Energy Information
    â—¦ Power Smart
    â—¦ Energy Efficiency: First Things First
    â—¦ Energy Efficient Home Articles

    Part 2B: Improvements in Efficiency

    Monday, December 18th, 2006

    A Brief Look at Three Regions

    Most energy efficiency analysis is regional — here are links to discussions in three important regions. The US national government is not currently emphasizing climate change and energy issues as much as some of the individual states, so links are provided to two California documents.

    The European Union

    An EU report (Action Plan for Energy Efficiency: Realising the Potential) asserts that 20% of EU energy can be saved by cost-effective methods. (Note: Europeans have relatively high power and fuel prices.) In residential (retrofitted wall and roof insulation) and commercial (improved energy management systems) buildings, this potential is 27% and 30% respectively. Lower energy appliances, lighting, and equipment are important to this reduction. The potential savings in manufacturing is about 25% (motors, fans and lighting). The 26% savings in transportation requires shifting modes of transportation.

    Given the importance of the human factor in reducing energy consumption, this action plan also encourages citizens to use energy in the most rational manner possible. Energy efficiency is about informed choice by individuals, not just about legislation.

    Plans include:

    • Better labeling of appliances for consumers and minimum energy standards
    • Building performance requirements and very low energy buildings (“passive houses”).
    • Improved electricity production and transmission.
    • Reduced greenhouse gas emissions from cars to below 120 g CO2/km (averaging 39.2 mpg for gasoline engines and 44.4 mpg for diesel). There is a voluntary goal of 140 g CO2/km by 2008/2009. See Green Car Congress’s 2006 look at which cars are on target to meet the voluntary reductions. Additionally, better tires and tires at the correct pressure can improve vehicle fuel efficiency by more than 5%.
    • Providing education and training for energy managers in industry and utilities. Provide teaching aids for elementary, secondary, and vocational ed curricula.
    • Bringing together a “Covenant of Mayors” from 20 – 30 of Europe’s largest and most pioneering cities to discuss what works.
    • An international framework for both the developed and developing world.

    Renault Clio III
    Renault is on track to meet the guidelines, having reduced average carbon emissions from 169 g/km in 1997 to 139 g/km in 2004. The Clio III gets 64 mpg, 117 g CO2/km.

    United States

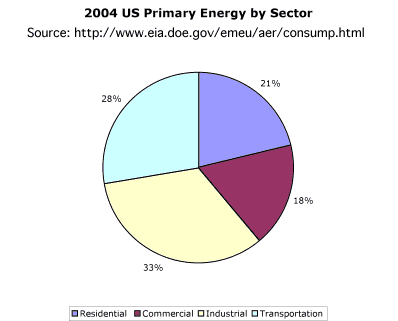
    In 2004, Americans consumed 9,336 BTU/$2000 GDP, comparable to the northerly Swedish and 50% more than the British and Swiss. (See World Energy Intensity–Total Primary Energy Consumption per Dollar of Gross Domestic 2004). We are rich, we pay relatively little for fuels and electricity, and we use them inefficiently. We have lots of room for improvement!

    Presumably Americans can also reduce energy use more than 20% in a cost effective manner, and even more if we increase the price of energy to more accurately reflect its costs.

    Per person electricity consumption has remained flat in California over the last 30 years, while increasing 45% in the US. This has coincided with the nationwide introduction of air conditioners and increase in the percentage of Americans living where air conditioning is considered necessary, the larger house, and California programs to reduce electricity and natural gas use. The California Energy Commission 2005 Integrated Energy Policy Report estimates 30,000 GWh can be saved over the next decade with an aggressive energy savings goals. This represents more than 10% of today’s consumption, but with population and per capita income increases, shifts in where Californians live, electricity consumption is still expected to increase by 10% even so.

    A competing priority is to reduce electricity use especially during peak usage times, when cost and pollution rise. Some peak power plants only operate a few hours/year, and reliability margins are tight in southern California. The peak load plants are least efficient, so saving a kWh there reduces GHG more than at other natural gas plants. Additionally, power companies pay every electricity producer whatever they pay the most expensive. The priority will shift from reducing lighting – with its enormous energy use – to emphasizing air conditioning and commercial lighting. The emphasis on new building construction and appliance standards has helped reduced the peak load utilities must produce by 6,000 MW, and more savings are expected.

    Climate Action Team
    The Climate Action Team Report to Governor Schwarzenegger and the Legislature looks at what may happen in CA if GHG emissions are not decreased, priorities, and how to achieve them.

    Efficiency priorities include reducing idling in diesel engines, vehicle and tire standards, water use (19% of CA electricity goes to water!), appliances, and buildings.

    China

    In a recent discouraging trend, the energy use in China is now increasing faster than GDP.
    Energy and GDP

    For more than two decades, increases in energy were well below increases in GDP, a striking achievement for a developing economy. China accomplished this by investing in improving efficiency, 10 – 13% as much as in new energy sources, in the 1980s. This dropped to 9% in the 1990s. Energy use doubled in these two decades, while GDP quadrupled. The Chinese hope to repeat this accomplishment in the two decades 2000 – 2020.

    Energy Efficiency Investment has Declined as a Proportion of Total Energy Investment

    Energy Efficiency Investment

    [The] continuation of a trend that became particularly pronounced after 1996. As a percent of energy supply investment, energy efficiency investment fell from a high of 13% in 1982 to a low of about 3% in 1996, with only a slight rebound since then.

    Chinese academics told Deng Xiaoping early that China’s economic growth would be much slower if energy were not used much more efficiently. During his leadership, a close relationship was established with a number of foreign groups, including Lawrence Berkeley Lab’s China Energy Group in the Environmental Energy Technologies Division.

    One of their publications is Evaluation of China’s Energy Strategy Options (download from here).

    Many of us in the West still see China as a centrally planned economy, but it faces some of the same problems we in the US see:

    China cannot meet its soaring demand for energy services without substantially increased investment in energy efficiency. Energy conservation seems like common sense, but there are entrenched interests in every country—oil companies, gas companies, coal companies—pushing to expand supply rather than cut demand.

    The to-do list is formidable.

    • Create a Ministry of Energy to promote environmental protection and energy efficiency. It would require much increased staffing, better data to support decision-making, and integrate consideration across sectors such as environmental degradation and regional inequality. Relatively few people administer energy policy in China compared to other major energy users.

    • Financial recommendations include spending 10% of energy investment on efficiency. China would pay some of the costs herself, but could try to get foreign investment as well.

    • Regulatory recommendations include better enforcement of existing standards, tighter standards for fuel economy, as well as appliances, utilities, and industry. Ensure that prices of energy reflect energy goals. Prepare long-term strategic infrastructure plans for land-use and transportation.

    • Advocacy goals include continuing public outreach programs, and making efficiency agreements with industry.

    This report also addresses topics unrelated to efficiency, such as subsidies for renewables and clean coal.

    Summary

    Reducing energy use by increasing energy efficiency is doable, and there are many paths that will save money. Lots of money. We can hope that interest in efficiency, and money for research and advocacy, moves up priority lists.

    Part 2A: Improvements in Efficiency

    Monday, December 18th, 2006

    Efficiency is doing the same with less energy. For now we will exclude such practical measures as mandating temperatures in public buildings (do DC buildings really need to be so hot in the winter and so cold in the summer?), though estimates below do include driving smaller cars.

    World population is increasing by 1.2%/year worldwide, by 0.9% in the United States (the largest greenhouse gas emitter). Per capita consumption is rising in both the developed and developing world, though faster in the latter. How much can we reduce increases in energy by better efficiency policies, and more research?

    McKinsey Global Institute addresses this in Productivity of Growing Global Energy Demand. Unless otherwise indicated, all information below comes from their report.

    What is current world energy demand?

    The largest chunk of world energy consumption is industrial, 31%. Electricity production is second at 22%. Residential energy use (excluding electricity) and transportation (light vehicles and air) are each 19%. Commercial energy use (excluding electricity) is 6%, oil refining is 2%, and agriculture 1%. Obviously these numbers vary regionally – in California, 40% of greenhouse gas emissions comes from transportation.
    US Primary Energy by Sector

    Source: US Department of Energy. The US devotes a disproportionate amount of energy to transportation.

    The richest 1/5 of the world population uses much more than our share of the energy, and emit much more than our share of greenhouse gas emissions.
    World Energy Consumption by Region

    Source: World Bank

    World Population
    World Share in Population

    Source: United Nations Food and Agriculture Organization

    If energy productivity rises, energy demand decreases, money is freed up and the economy grows. Improvements can come from smaller appliances and cars, or more efficient ones. From a shift in energy supply, from biomass to electricity, for example. Or with changes in the economy that produce economic growth with less energy consumption, eg, as real wealth shifts from large cars to small computers.

    There is significant room for improvement from investments with Internal Rate of Returns greater than 10%. Energy growth could be held below 1% per year – from the expected increase of 2.2%/year between now and 2020 (it would be 3.2%, but baseline scenario includes 1% gain in energy productivity/year).

    However, market-distorting subsidies, information gaps, agency issues, and other market inefficiencies all work against energy productivity. Furthermore, the small share of energy costs for most businesses and consumers reduces end-use response to energy-price signals.

    So policy changes must include standards, and more and clearer information for the public.

    What to do:

    • Huge amounts of energy can be saved in residences: better insulation, and higher efficiency bulbs, appliances, and water heating – but these methods have to be used! Only 6% of light bulbs worldwide are compact fluorescents. (See Barriers to Technology Diffusion: The Case of Compact Fluorescent Lamps (pdf). Nine percent of energy, and 8% of GHG, result from worldwide lighting. Compact fluorescent bulbs require 20 – 25% as much energy to produce the same light as an incandescent bulb.) This could produce 16% of possible energy savings between now and 2020.

    • More efficient electricity production and transmission. 12% of savings

    • Industry can save 40%, particularly in the developing world. Refining and steel manufacture are two big areas.

    • China can save 2% itself just by opting for high-efficiency coal plants over the current model, and bringing building shell standards in line with those for similar climates.

    Again, standards are important where information is difficult – for individuals, for example. Fuel taxes might be more effective in changing car-buying decisions in the US, with its slow turnover of stock, but China may want to improve its fuel efficiency standards given how many will buy cars soon.

    Funding research

    McKinsey Global Institute does not address the need for government funded research, but research leads to huge savings. From chapter 3 (pdf) of Federal Energy Research and Development for the Challenges of the 21st Century:

    Between 1978 and 1996, the Federal government invested some $8 billion (1997 dollars) in research, development, and deployment of energy efficiency technologies. This work, in conjunction with other policies (such as standards and incentives), private R&D, and the pressure of high energy costs, helped spur a private sector investment achieving the $150 billion in annual savings-a tremendous return on investment. Besides these financial savings, DOE-supported technologies have led to significant improvements in the environment and human health.

    Low-e Window
    Low-e Window

    According to Lawrence Berkeley Labs,

    Low emissivity windows already installed will save the U.S. $2 billion over their 25-year lifetime.

    Local Foods — Another Side of the Argument

    Thursday, December 14th, 2006

    The Economist has written on problems in a rigid adherence to local foods. Sometimes less energy is required to ship food longer distances. (And presumably GHG emissions are lower.)

    In Britain, half of food miles result from the consumer driving to the shop. We may wish to reconsider how we get to the store.

    Growing food in Britain can be more energy intensive than growing it elsewhere, eg, British tomatoes grown in greenhouses compared to Spanish tomatoes shipped in. Even New Zealand lamb, apples, and onions are lower energy than British products.

    The article attacks some of the premises behind organic and Fairtrade products as well. Major arguments against organic food, according to the article, include a significant increase in land under cultivation, and that some organic techniques are environmentally as bad as other methods of growing food. Major arguments against Fairtrade include how little of the Fairtrade dollar makes it to the producer, the exclusion of large producers, and the market distortion caused by a guaranteed income (fewer coffee producers would increase prices more effectively). They omit an argument I once heard from a food specialist — that for the US to grow all food and fiber organically, we would need to eat 10 times as much meat. (Has anyone seen that statistic?)

    One possible conclusion of the Economist article is that we will accomplish more by assuring a rational system (higher prices for energy use and greenhouse gas emissions to better reflect their costs) — for each of us to navigate the complexities of food production is harder and less effective. Another might be that using no-carbon transportation to shop, and buying in-season products, does help. A third might be that we eat products that are always energy intensive — lamb in Britain and fish most places — occasionally.

    Comments?

    Farmers Market
    Farmers Market

    Plug-in Hybrid Cars

    Tuesday, December 12th, 2006

    Hybrid cars combine two technologies, usually a battery and a gasoline or diesel engine. With a large battery, the engine doesn’t have to produce as much power, and doesn’t have to be built to operate over a large range of power requirements, from driving at a constant 30 mph to merging into freeway traffic. The battery assist allows the engine to operate more often in its most efficient range.

    Plug-in hybrids use an even larger battery. If they are charged up at night, they can go short distances (20 miles or more) during the day with battery power alone. On average, cars are expected to get about 100 miles to the gallon with a charging cost of $1/gallon.

    There are several obstacles to plug-in hybrid cars. The car costs much more, and batteries need to be replaced and disposed of. New coal power plants will spew pollution and greenhouse gases. Batteries are polluting under the best of conditions.

    There are advantages as well. Utilities would be able to use more base load power plants (running 24/7) and less of the more expensive peak load plants (not true where hydroelectric power is used for baseload). Oil use would drop dramatically if all vehicles are plug-in hybrids, bringing down both the price of oil and the amount of money going to oil powers.

    From National Renewable Energy Laboratory
    Plug-in Hybrid

    Standard hybrid electric vehicles contain a small- to medium-sized battery pack and electric motor. These devices help the engine operate more efficiently and enable normally wasted braking energy to be recaptured. While hybridization helps improve the fuel efficiency of hybrid vehicles, all of the energy used still comes from the fuel tank. Even the energy stored in the battery was once fuel.

    In contrast, plug-in hybrid electric vehicles have the ability to recharge their batteries with electricity from the utility grid. They typically have larger battery packs and will use the stored electric energy instead of gasoline whenever possible. Under some conditions, a plug-in hybrid may even operate on electric power only. When needed, the engine and liquid fuel will be used to extend driving range and enhance performance. An onboard computer decides when to use which fuel.

    Hence its name, a plug-in hybrid features a plug, which can be plugged into a standard 110-volt outlet for recharging the batteries.

    Ice-Free Arctic Summers by 2040?

    Monday, December 11th, 2006

    New modeling based on recent data indicates that the Arctic will be ice-free in the summer much earlier than once predicted, according to scientists from National Center for Atmospheric Research (NCAR).

    Scenarios run on supercomputers show that the extent of sea ice each September could be reduced so abruptly that, within about 20 years, it may begin retreating four times faster than at any time in the observed record…

    The model results indicate that, if greenhouse gases continue to build up in the atmosphere at the current rate, the Arctic’s future ice cover will go through periods of relative stability followed by abrupt retreat. For example, in one model simulation, the September ice shrinks from about 2.3 million to 770,000 square miles in a 10-year period. By 2040, only a small amount of perennial sea ice remains along the north coasts of Greenland and Canada, while most of the Arctic basin is ice-free in September. The winter ice also thins from about 12 feet thick to less than 3 feet.

    The research team points to several reasons for the abrupt loss of ice in a gradually warming world. Open water absorbs more sunlight than does ice, meaning that the growing regions of ice-free water will accelerate the warming trend. In addition, global climate change is expected to influence ocean circulations and drive warmer ocean currents into the Arctic.

    “As the ice retreats, the ocean transports more heat to the Arctic and the open water absorbs more sunlight, further accelerating the rate of warming and leading to the loss of more ice,” [NCAR scientist Marika] Holland explains. “This is a positive feedback loop with dramatic implications for the entire Arctic region.”

    Arctic Sea Ice Summer Minimum in 2005
    Arctic Sea Ice Summer Minimum in 2005

    From National Oceanic and Atmospheric Administration:

    Arctic sea ice extent on September 16, 2005, a summer minimum for 1900-2005. Note the large areas of open water north of Alaska and Siberia which are already occurring in the Summer Arctic.

    Picture from the University of Illinois.

    The color scale shows concentration of sea ice; magenta is 100%.

    Eating Local Food

    Sunday, December 10th, 2006

    Gretchen sent me a link to 100 Mile Diet — Local Eating for Global Change.

    The average American eats food that travels many hundreds of miles. Fish and out of season fruit and veggies often travel from another hemisphere. Eating locally will reduce our greenhouse gas emissions. How do we go about it?

    I haven’t posted on this subject before because northern California abounds in local produce all year; it’s easy for us to eat locally. But the 100 Mile Diet people live in Vancouver and are shifting local consumption patterns as they shift their own.

    How is eating locally where you live? What makes it easier?

    You are walking or bicycling to purchase local food, right?

    Quaker Gray Goes Green

    Thursday, December 7th, 2006

    Friends Center in Philadelphia is being rebuilt with a large number of green features:

    * Standing Column Well Geothermal Heating and Cooling that will help to totally eliminate fossil fuels and carbon emissions.
    * Stormwater capture and reuse that will reduce stormwater outflow by 288,000 gallons per year, and eliminate potable water consumption 90% by using storm water for flushing toilets.
    * Vegetated Roof to offer increased insulation value and passive cooling that will yield a 5% reduction in cooling load, handle all of the stormwater for 90% of rain events, double the effective life of the roof, and reduce urban heat island effect.
    * Photovoltaic solar array that will generate 10 kWh per year and help reduce carbon emissions.
    * High performance glass that will allow greater daylighting and less solar gain, reducing energy consumption for lighting and cooling.
    * Recycling of construction waste.
    * Use of high recycled or rapidly renewable materials and low emission paints.
    * Open interior design and daylighting strategies to create healthier, more productive interior environment.
    * Exhibits outdoors and indoors and educational programs for environmental responsibility strategies

    Part One: Renewables and Improved Efficiency

    Thursday, December 7th, 2006

    Solar and Wind Power

    How much of a role is there in the immediate future for renewables plus better efficiency? This is the first of three posts on that subject.

    The production of wind and solar power is growing rapidly, but that’s rate, not amount. According to International Energy Agency, (unless noted otherwise, most of the rest of this blog is based on the IEA book, Renewables for Power Generation- Status & Prospects):

    Installed Capacity and Electricity Production
    This table overestimates electricity production worldwide — I couldn’t find capacity factors for world; US values are higher.

    * US capacity factor values (from Nuclear Energy Institute) are used, rather than world values. To obtain kWh, multiply GW by 24 x 365 x capacity factor. Divide by 1,000 to get units right. Capacity is lower than 100% for solar because the sun isn’t always up, and because the sun’s rays aren’t always perpendicular to the photovoltaic (PV) panels. Wind power capacity is less than 100% because the wind is not always blowing; in particular, there is often little wind on very hot or very cold days. Estimates on kWh produced by each technology are probably high. For example, the capacity factor for German wind is about 20%. The capacity factor for European PV panels is also likely less than US values, as much of Europe is north of California. The latitude for Rome is 42 N, while New York City is 41 N.

    More on Solar

    Thin Film PV
    Thin Film PV. Some are optimistic that thin film PV is the cheaper technology of the future.

    PV panels break even on energy in 2 – 5 years; at that time they have produced as much electricity as was required to construct the panel. They last 20 – 30 years (after which they still produce electricity, I think, just less — someone told me that they deteriorate by 0.5%/year), but inverters and batteries must be replaced every 5 – 10 years, more often in hot climates. Producing PV panels requires toxic metals, but they appear not to be getting into environment and human body via production or waste. Prices and use of toxic metals are going down, efficiency is going up. They work best in areas with large amounts of sun, and expensive daytime power. At some point, land use may become an issue; but

    (b)uilding stock in industrialised countries offers enough suitable surfaces for PV to generate between 15% and 50% of current electricity consumption.

    This will be less than 15 – 50% of 2050 consumption under even the most optimistic population and efficiency improvement scenarios.

    PV Integrated into Roof Shingles
    PV Integrated into Roof Shingles

    Much greater investment in research and development is crucial. Independent of climate change, investing in solar is investing in cheaper electricity tomorrow.

    For information on solar lighting (using optical fibers to light with sunlight), solar hot water and space heating, and more on solar power, visit the National Renewable Energy (NREL) solar site.

    More on Wind

    Windmills are growing in capacity, with new wind turbines in the MW range.

    The intertwined problems of intermittency and impacts on grid reliability present two of the strongest challenges to wind energy’s future prospects. When wind is providing too much or too little power, the reliability of the grid is affected. Because wind is based on natural forces, it cannot dispatch power on demand. Because utilities must supply power in close balance to demand, intermittency can limit the amount of capacity of highly intermittent technologies that can be integrated into the grid. Thus, as the share of wind energy increases, integration of wind turbines into the electrical network will need both more attention and investment.

    In Denmark, some local regions in Spain, and in Northern Germany, penetration rates of over 15% (and even up to 50% for a few minutes) have been seen. In some instances, this has caused grid control and power quality problems, but not in other cases.

    Wind turbines located offshore and in mountainous terrain are subject to potentially very high costs for O&M and loss of availability due to climatic influences.

    This is likely to be a problem for hydroelectric power in some areas.

    NIMBY is putting increasing pressure on windmill placement both in the US and Europe.

    Note: wind prices will decline with technology improvements, but at some point, wind expansion will only occur if less windy regions are used.

    Wind power causes local climate change; this may be good or bad for the region.

    For more on wind power, visit the NREL wind site.

    The IEA book also reviews small hydropower, biopower (using plants to make electricity), geothermal power (not technically renewable), and concentrating solar power (to heat water, then combine with biopower or natural gas). NREL has information on these and other technologies.

    Biopower and small hydropower were each of more importance than wind in 2000. But wind power growth is so rapid that by 2010, the majority of the installed capacity from these systems is expected to be from wind (though not the majority of the electricity production because of the lower capacity factor.)

    Storage Systems for Solar and Wind Power

    Neither wind nor solar power is considered base load power (on all the time). They operate with either hydroelectric or natural gas backup. In areas with more wind at night, the electricity produced may be wasted.

    It is not likely that solar will provide base load power for decades, if ever. (Batteries are expensive and polluting.) A storage system for wind power, compressed air energy storage, is being tested at a couple of sites, including Connecticut, and has been proposed elsewhere, including Iowa. During times of peak electricity needs, natural gas is blended with the compressed air; the mixture then drives a natural gas turbine.

    Argonne National Lab looks at salt caverns appropriate for storage.

    Compressed Air Energy Storage in Salt Cavern
    Compressed Air Energy Storage in Salt Cavern

    A later post (the next?) will look at improvements in efficiency.

    China: 21st vs 19th Century Technology

    Monday, December 4th, 2006

    WeSupportLee always has excellent and interesting posts. A recent one looks at nuclear power vs coal power in China.

    China, which is very careless of coal miners and people with lungs, appears to be running a first world nuclear power program.

    WeSupportLee also has had several posts following changing attitudes towards nuclear power in Australia. I haven’t been able to follow all of the names, but there appears to be a strong connection for some Labor politicians between their support of the coal industry, or vice versa, and their stated concerns about nuclear power safety. This is of course true of some American politicians as well.

    One point that struck me as an American — the most recent report points to flaws in Australian teaching about nuclear energy, and they want to fix this. In the US, we have no national control of science teaching, so far as I know.

    Santa Anas Fanning Fire in December

    Sunday, December 3rd, 2006

    Last year, we in Berkeley experienced hot fall winds in November.

    Today’s story, Fires Threaten Dozens of Homes in Calif., says that strong Santa Ana winds are driving fires in Ventura County.

    This year’s wildfire season in the U.S. was the most severe – and expensive – on record. As of Dec. 1, fires had burned more than 9.5 million acres, according to the National Interagency Fire Center. The U.S. Forest Service has said it spent $1.5 billion fighting those fires – about $100 million over budget.

    Climate change projected fire weather sensitivity: California Santa Ana wind occurrence in the Geophysical Research Letters, says,

    This initial analysis shows consistent shifts in SAO events from earlier (September–October) to later (November–December) in the season, suggesting that SAOs may significantly increase the extent of California coastal areas burned by wildfires, loss of life, and property.

    Canada: Head of Liberal Party Chosen to Address Climate Change

    Sunday, December 3rd, 2006

    Wow!

    from the Washington Post:

    In a convention that underscored the rising political weight of climate change issues, Canada’s Liberal Party on Saturday chose Stephane Dion, a former environment minister, to lead the party and try to wrest power from the ruling Conservatives in the next national election.

    Wind Power and Birds

    Saturday, December 2nd, 2006

    I suspect that overall, the problems in terms of biodiversity loss to birds and bats from coal and natural gas power is more important than direct deaths from collisions with windmills, but how bad is that? Thanks to Oliver and Kelly for sending references on the subject.

    On one side of the debate are those who say that windmills are not so harmful to birds. Industry reports most studies have found few bird kills (the Altamont Pass in CA is an exception), and that there are more significant dangers to birds (though they don’t distinguish between endangered species and more common species). They correlate higher risks with some areas and some types of turbines, but give no details. They also report briefly on bats.

    Dead Raptor in Altamont Pass
    Dead Raptor in Altamont Pass

    National Renewable Energy Laboratory, or at least some researchers at same, agree. Brian Parsons (Some Common Misconceptions about Wind Power, pdf) addresses only the bird portion of the question:

    Wind turbines kill birds and thus have serious environmental impacts.
    Responses:

    __ Bird kills have caused serious concern at only one location in the U.S.: Altamont Pass in California. This is one of the first areas in the country to see significant wind development. Over the past decade, the wind community has learned a great deal about siting wind plants in ways that avoid locations that might pose problems for birds. Modern wind installations are simply not raising avian concerns.

    __ One to two bird kills per turbine per year is at the high end of the range observed in U.S. wind installations. The majority of deaths are common species. Compared to bird deaths resulting from other manmade structures, highway traffic, and housecats, bird kills by wind plants are numerically insignificant and are not expected to impact bird populations. Of course, deaths of endangered species are of greater concern, but again the only location with a suggestion of this problem is Altamont. And even in that case, experts disagree on the severity of the problem.

    __ Environmental impacts are relative. All energy technologies have some negative environmental impacts. Society makes tradeoffs when making power plant choices. Wind plants may result in some bird fatalities or other unwanted impacts on wildlife and their habitats. Coal plants cause premature human deaths from respiratory problems. Maintaining open channels for free flow of oil causes military deaths. Society needs to choose from these alternatives, and it cannot assess a single energy technology in isolation.

    It is absolutely true that we need to compare the total advantages and disadvantages of each technology in choosing among them.

    Other analyses have now shifted my thinking from skeptical to open minded.

    Audubon in CA hosted a conference, you can see their reports here.

    The following comes from a California Energy Commission 2005 report, Asessment of Avian Mortality from Collisions and Electrocutions (pdf)

    The conclusions are relevant for CA, which appears to have the most bird problems with windmills (Altamont Pass has the most problems in CA).

    From the Summary of Staff Findings and Policy Options

    Most Bird Species Killed by Interactions with Wind Turbines or Electrical Power Line Infrastructure are Protected by Federal and State Laws and Regulations.

    The California Energy Commission (Energy Commission) Could Promote Development of New Wind Resources Only in Areas That Have Low Risks to Birds.

    The Energy Commission Could Support Statewide Guidelines Requiring the Wind Industry to Mitigate Its Impacts on Birds in the State.

    In the Altamont Pass Wind Resource Area, the Energy Commission Could Encourage Industry to Apply Mitigation Measures to Existing Projects, New Projects, and Repowering Projects to Reduce Bird Deaths—Ultimately, implementing mitigation could allow industry to expand if Alameda County was able to lift its moratorium because of a reduction in bird kills.

    The report also suggests much better monitoring of bird and bat kills across the state, and a shift from voluntary to mandatory guidelines.

    Mandating Improved Efficiency

    Saturday, December 2nd, 2006

    A Washington Post editorial argues that having better technological choices available for consumers isn’t sufficient, that we need to mandate improvements in efficiency, both in energy production and consumption.

    They cite the Mckinsey report. From the executive summary (free registration necessary):

    According to McKinsey Global Institute (MGI) research, global energy demand will grow more quickly over the next 15 years than it has in the last 15. Demand will grow at a rate of 2.2 per cent per year in our base-case scenario, boosted by developing countries and consumer-driven segments of developed economies….

    MGI’s in-depth case studies indicate that there are substantial and economically viable opportunities to boost energy productivity that have not been captured—an estimated 150 QBTUs, which could represent a 15 to 25 percent cut in the end-use energy demand by 2020. This would translate into a deceleration of global energy-demand growth to less than 1 percent a year, compared with the 2.2 percent anticipated in our base-case scenario—without impacting economic growth prospects or consumer well-being….

    Shifting global energy demand from its current rapid growth trajectory will require the removal of existing policy distortions; improving transparency in the pricing and usage of energy; and the selective deployment of demand-side energy policies, such as standards.

    All economic analysis says we must improve efficiency (doing the same with less energy) or there are no solutions to climate change. Additionally, producing much more energy means increasing per unit costs of energy production — those who haven’t switched to compact fluorescent light bulbs are increasing my electricity bill.

    Should we mandate better ideas?
    Should we mandate better ideas?

    Other Friends Speak

    Friday, December 1st, 2006

    Linda describes what she’s learned riding the bus.

    Bob in Philadelphia has a 3-part blog, Design for What? musings on parking garages and getting around Philadelphia. Part 1, part 2, part 3.

    Insurance Companies Making Climate Change Policy

    Friday, December 1st, 2006

    A place near the water has been an American dream for a very long time. Fifty-four percent of Americans live within 50 miles of a coast.

    This is the year, however, in which the big boys in global finance got religion about climate change. As a result, this American dream — as far north as the Washington area, and even New York and New England — is under attack.

    So begins a Washington Post article, A Dream Blown Away.

    Highway fatalities dropped when insurance companies started financially punishing unsafe drivers, as well as makers of unsafe cars. Cigarette smokers saw their life insurance premiums skyrocket.

    The big buzz in the insurance industry today is climate change.

    Lloyd’s of London’s June report is titled: “Climate Change: Adapt or Bust.”

    Insurance companies are focusing on areas susceptible to hurricanes and sea level rise. Quite a few people with expensive houses can’t buy insurance.

    Hurricane Jeanne in Maryland
    Hurricane Jeanne in Maryland