How much CA electricity comes from renewables?

November 28th, 2017

When you hear that a huge percentage of electricity comes from renewables, what comes to mind?

Most people I ask in non-hydroelectric states assume that local solar and wind are being integrated into the grid in large quantities, and that it’s a hop, skip and a jump to twice that much. They also assume that solar and wind produce 0 greenhouse gas (GHG) emissions.

An article based on a recent California Public Utility Commission Report helps create the large quantity kind of thinking:

Two years ago, Gov. Jerry Brown signed an ambitious law ordering California utility companies to get 50 percent of their electricity from renewable sources by 2030.

It looks like they may hit that goal a decade ahead of schedule.

An annual report issued Monday by California regulators found that the state’s three big, investor-owned utilities — Pacific Gas and Electric Co., Southern California Edison and San Diego Gas & Electric Co. — are collectively on track to reach the 50 percent milestone by 2020, although individual companies could exceed the mark or fall just short of it.

In 2016, 32.9 percent of the electricity PG&E sold to its customers came from renewable sources, according to the report. Edison reached 28.2 percent renewable power in 2016, while SDG&E — the state’s smallest investor-owned utility — hit 43.2 percent.

Where does CA electricity come from?
In 2016, California generated 198,227 gigawatt hours (GWh, a billion Wh or a million kWh). California’s net imports (imports minus exports) was 92,341 GWh. Total consumption in 2016 was 290,568 GWh.

What percentage of current California consumption comes from in-state renewables?

% CA electricity from source
source GWh produce % of CA electricity
1 Small Hydro 4567 1.6%
2 Biomass 5868 2%
3 Geothermal 11582 4%
4 Wind 13500 4.6%
5 Solar (concentrated solar)* 2548 0.9%
6 Solar (panels)* 17235 5.9%
7 Total Renewables 55300 19.0%

*Solar information separated

What is the difference between actual and reported numbers?

Of 42,378 GWH imported from the Pacific Northwest, 11,710 GWh is California built, mostly wind, but also biomass, small hydro, and a bit of geothermal. Of 49,963 GWh purchased from the Southwest, 3,791 GWh is CA solar sited out of state, along with 2,097 GWh in wind and 1,038 GWh geothermal.

It doesn’t make sense for CA to produce all its power in state. Traditionally, the Pacific Northwest supplies hydro in the winter and spring, for example, and California transmits power north in the summer. Southern California buys cheap coal, most of which is generated out of state to avoid polluting California. The coal contracts will expire, but California will continue to import electricity. (Resource shuffling, California shifting its purchase to gas, and another entity buying the coal, may mean the actual drop in carbon dioxide emissions less than if California built low GHG generation in state.)

But now California is building out of state in order to pad the bottom line for renewables, although these do not help with the California goal of figuring out how to better integrate solar and wind into the grid.

Does it matter that CA is not producing as much renewables as people assume?
Almost 1/3 of California renewable electricity is generated out of state.

First, the goal appears to be renewables instead of decarbonization. Wind blows in the spring in the Pacific Northwest, competing with spring runoff during a low demand season. It blows other times of year, but peaks in the spring.
capacity factor of wind 
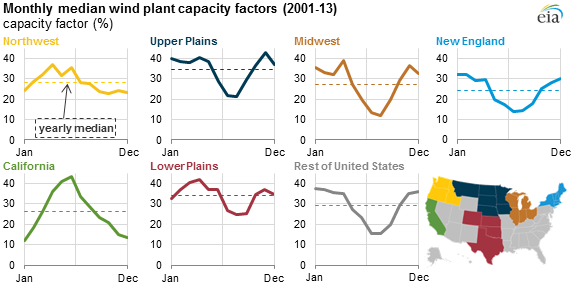
Some of this wind doesn’t help us address climate change. It does help CA meet renewables mandates.

Many assume that California is showing how easy it is to get 1/3 or 1/2 of electricity from intermittent wind and solar. We’re definitely not there yet. Possibly, though, a premature feeling of success leads to less questioning of the chosen path.

Low levels of wind + solar still lead to integration problems.
Considerably less than 10% of California electricity comes from solar, yet for the first half of 2017, prices/kWh average below 2 cents between 10 AM and 4 PM. In March and April, there were at least 19 days where prices were negative, where solar would have stopped producing in the absence of a production tax credit (2.4 cent/kWh).

The low price doesn’t mean that consumers pay less, rather, that building more generation for those hours doesn’t make economic sense. California is building more solar.

Germany exports “typically half” of each solar (6%) + wind (12%) bump, demonstrating how hard it is to integrate into its grid.
Germany: solar and exports
Germany solar and exports, (figure 3)

Don’t all renewables have low GHG emissions? A positive, right?
How do wind and solar with gas backup compare to gas by itself? To nuclear and Washington hydro?

The Intergovernmental Panel on Climate Change estimates a median of 48 gram CO2-equivalent/kWh for building solar panels, over the complete life cycle. (Rooftop solar produces less electricity per panel than utility solar parks, so median GHG emissions are greater. Solar has higher emissions in areas with less sun, like Germany.) The median for wind is even lower, 11 g. (CO2-eq includes all emissions, not just carbon dioxide.) While the fuel may be free, solar and wind have a number of manufacturing steps. Silicon used for solar panels has to be purified at 1,100°C (2,000°F).

Compared to natural gas, 510 g (Table 1.06), solar and wind appear much better, but backing up with gas adds to that. Not only do clouds and wind come and go, requiring gas to follow, but there is a rapid ramp up of gas between 4 PM and 7 – 8 PM, when electricity demand peaks.

CA duck curve
CA duck curve

A Carnegie Mellon analysis finds that backing up solar and wind has associated GHG emissions of 21-24% of the backup gas. This is because gas plants, whether efficient or fast responding, run more inefficiently when they are ramped up and down to follow solar and wind, just as the fuel economy of cars falls when they change speed often. So 1 kWh of solar or wind in California has GHG associated with manufacture, somewhere around 11 or 48 g, plus another 105 to 120 grams from the backup, 115 to 165 gram/kWh. Still better than gas, about 1/4 to 1/3 as bad as gas.

While it’s difficult to directly measure, the extra emissions appear to have been observed. California Public Utility Commission found that between 2001 and 2016, the most efficient gas plants, which are not used primarily for backing up solar + wind, are now producing 5% more carbon dioxide (Draft 2017 IEPR last line page 103).

When there is little solar and wind, in the winter, California imports hydro from the Pacific Northwest, and uses gas.

By contrast, nuclear produces 12 g CO2-eq/kWh, according to IPCC. Hydro may be even lower.

It will take some work to integrate more solar and wind onto the grid
California will continue to add more renewables, so changes are needed. National Renewable Energy Laboratory (NREL) tackles how to increase California’s in-state level of solar power to 28% in Emerging Issues and Challenges in Integrating High Levels of Solar into the Electrical Generation and Transmission System. If all goes as planned, this will lead to 30% of solar being curtailed (tossed) compared to a bit under 2% today. Solutions include better forecasting, and changing demand response in a variety of ways (changing the time of day power is used, and how decisions are made). Energy storage (batteries) will also be needed, although batteries are energy intense (batteries made with coal power result in emissions of 100+ g CO2-eq/kWh, for the least energy intense battery), plus the emissions from power generation.

Perhaps the Northwest can send less hydro mid-day and more around 7 – 8 PM. Pumped hydro storage might work with wind, so that it becomes available later in the day.

Both battery storage and curtailing require extra solar + wind, with extra emissions (some 20% of electricity is lost in the charge discharge cycle), with higher emissions. However, GHG emissions of solar production should drop some.

Is this the path CA should be on?
It would be useful to see this question answered, comparing alternatives. California currently has chosen a higher GHG path than some to address knotty problems that come with double digit percentages of wind or solar. Progress is being made, although the popular idea that 30% of 2020 electricity will come from 0 GHG renewables is incorrect.

I heard a climate scientist cry today

November 10th, 2016

Y’all are hearing climate scientists freak out. Let me give you the historical background, as seen by someone who was completely clueless until 1995.

Back in the mid-90s, scientists were elated that the public was paying attention to climate change, and had been since Jim Hansen’s talk to Congress in 1988. The public actually had confused climate change and the ozone hole; the public was not paying attention to climate change, and the ozone hole/climate change distinction wasn’t clear for most people until more than a decade later. It was on the list of concerns discussed by environmental organizations, but until Gore’s movie in 2005, climate change pretty much did not regularly make the monthly newsletters. It didn’t appear to most to be a particular environmental concern. The more important concerns seen by those reading environmental newsletters were GMOs and nuclear power. For almost a decade after that, the media continued to cover climate change as if it is valid to say on the one hand scientific consensus, on the other hand…

I can read scientist understated, and the image of the Tarot card with the man jumping out of the burning building became my picture of where climate scientists were in 1995. Scientists, like most academics, speak in understated, but it was clear they were scared. Later I read in Weart’s History of Global Warming that young scientists 3 decades earlier had begun to realize that their research wasn’t about the abstract future, but for changes that would occur in their lifetime.

Since my introduction in 1995, the scientific understanding for how bad how fast have become more pessimistic on a regular basis. Just one example: for the first several years, I read that ice sheet melt was expected to become as important to sea level rise as warmer water expanding in about 1,000 years. Instead, ice sheet melt may pass thermal expansion this century.

Additionally, the rate of greenhouse gas emissions escalated way beyond business as usual scenarios. Additionally, scientists, who come from see-a-problem-address-the-problem culture watched in horror for decades as rich nations spent too little, and spent the money disproportionately on the most expensive solutions.

Scientists don’t know how to talk apocalyptic. Those who oppose solutions do. Scientists struggle to leave caveats and understatements out of their talks when they talk to the public. But they have been communicating as loudly as they can since 1988, do more, much more, much faster, do more. We are worried about the ability of governments to function at 4°C, which we are on track to reach by the end of the century or early next.

Only they are told, don’t scare people and make sure solutions look to be available. So essentially all climatologists leave out the “we are terrified at what is likely to happen in the lifetime of people today” portion, and say something pleasant about solar and wind.

If Clinton had been elected, things would most likely be really bad by mid-century. But Clinton wasn’t elected. Now a climate denier is giving governmental power to Ebell and other deniers and lukewarmers. Things are looking to be really really really really bad by mid-century.

We needed a public discussion of solutions during the election, because the public doesn’t yet understand the issues. This is to be expected. Take a topic as complicated as totally remaking the energy system (and making changes in agriculture, land use, and etc), add in what everyone learns in elementary school and so has complete faith in although it’s wrong, add in tribal understanding about natural and science and Big Biz, and the public discussion is a mess.

Here is is a portion of the bottom line:
I read people who are most worried about A or B or C or ZZZ who have been neglecting climate change. Climate change is not the only important issue, and not the only important environmental issue. But it is way more important than we are treating it.

We need to begin to talk more seriously about climate change solutions. Most everyone is safe in assuming that their understanding of the solutions is wrong, ditto their favorite sources of information (unless you read reports from the highest levels of peer review regularly). We probably need more solutions than y’all want to embrace (this has been my personal experience time and again), and there is probably something or two or three wrong with personal favorite solutions that y’all have been ignoring (ditto the personal experience line).

We need to begin the national dialogue on solutions. We need to move it to non-tribal. This is a multi-year job. Even with Clinton, there would have been no magical ah-it’s-been-4-months-and-we-understand-all sweeping the nation.

So who wants to add more discussion of the conflicts about solutions to what you have been doing? What questions about how to proceed do y’all have? Let’s talk.

And those of you who don’t like conflict and so don’t want to get involved in bringing the conflicts out to be discussed, consider the alternatives.

Nuclear Power as a Solution to Climate Change

March 22nd, 2016

A talk in San Jose

Fracking FAQ

June 28th, 2015

Fracking is not used for all natural gas/oil operations. Yet much of the US public/media discussion conflates natural gas and fracking, or fossil fuels and fracking—someone says natural gas, and the writer (or reader) changes it to fracking. People have sent me to ecowatch, The Guardian, and others that should do better.

So, hoping to decrease confusion a bit, here is US information on fracking, and human-caused earthquakes, followed by international differences.

What is fracking?
Hydraulic fracturing is one method of obtaining natural gas and oil.

fracking image
EPA

Water, sand, and chemicals are injected down a vertical well at high pressure to fracture the rock, increasing pore size. This allows gas or oil to flow more readily. Pressure is decreased, and the injected fluids, fluids from the ground, and gas or/and oil flow back up the well.

Wells are typically more than 1 mile (2 km) deep. This is where the gas/oil is, and well below the groundwater. The horizontal section is typically 1,000 – 6,000 feet (300 – 1800 meters). Wells require >1 million gallons/year.

Oil and gas in traditional wells flow without the fracking, although methods to improve flow are often used.

When was this method first use?
Fracking has been used in vertical wells for half a century; in California where I live, Kern County began using fracking in the 1970s. Its use in horizontal wells began in the late 1980s.

Update 7/4/2015: Naval Civil Engineering Laboratory did first tests on horizontal drilling in tests that began in 1985, and released their results in 1993.

How much of US/world gas and oil production comes from fracking?
About half of US gas and oil come from fracking.

Few countries currently frack, because of geological or political conditions. Those that do include China, Canada, and elsewhere—in Asia, Europe, and South America. (Wikipedia gives more details.)

Does fracking cause earthquakes?
The fracking process itself causes tiny ground motions which are monitored as part of the process. Sensitive equipment is needed; we can’t feel them. The Earth Story discusses these earthquakes, from – 2 to 1 on the Richter scale, on its facebook page.

There were three earthquakes as of 2012 attributed to fracking, all larger than magnitude 1, in Great Britain, Oklahoma (see Oklahoma link), and Canada. The National Research Council in Induced Seismicity Potential in Energy Technologies (2012) does not see an important risk from fracking earthquakes.

Over the last few years, it has become clear that injecting waste water from enhanced oil recovery, or natural gas or oil wells of any type, sometimes produces earthquakes. Guglielmi, et al discuss their study in the 12 June Science: they inject fluid into a particular fault, and seismicity depended on injection rate. Fracking wasn’t mentioned (although a number of articles and blogs link to this study in “fracking causes earthquakes” article.)

Weingarten, et al in the 19 June Science, use copious information from Oklahoma and Texas fossil fuel operations, then correlate earthquakes with reservoir depth, injection rate, etc. They found that before 2000, about 20% of seismicity in the central and eastern US was associated with injection wells; this rose to 87% between 2011 and 2014. Three quarters of this was associated with enhanced oil recovery. The only risk factor appears to be high injection rates (>300,000 barrels per month), so the oil and gas industry can cut earthquakes dramatically by reducing injection rates.

What’s in the water?
Injected water contains a number of chemicals to aid the process.

Mark Zoback, professor of geophysics at Stanford, served on a committee to look at hazards of fracking and how to address them; he isn’t worried about any of the chemicals used by industry. However, water coming out of the wells picks up considerable amounts of arsenic, selenium, and other constituents of the shale, and needs to be handled safely.

The committee recommendations to the Secretary of Energy on fracking can be found here.

Fracking does not contaminate groundwater, according to Dr. Ernest Moniz, Secretary, US Department of Energy, Lisa Jackson, former EPA Administrator, Dr. Mark Zoback, and others.

Does fracking result in huge natural gas release?
Brandt, et al in 14 February, 2014 Science found that US natural gas leaks have been underestimated. The evidence that leaks are larger than thought does NOT appear in areas where there is fracking.

Geothermal power sometimes uses fracking
In order to expand the use of geothermal energy, enhanced geothermal systems, or EGS, are needed. One of these methods uses fracking to increase the flow of hot water.

Independent of that, extraction of water for geothermal electricity can result in earthquakes. Monitoring is important, and, I understand, earthquakes from geothermal are easy to prevent.

Do other types of energy cause earthquakes?
Sichuan earthquake
Sichuan earthquake link

The May 2008 earthquake in Sichuan, killing 80,000 people, is widely believed to have been caused by the reservoir built to supply hydroelectric power. This assertion was made within days of the earthquake, based on the weight of the reservoir when full, and because earthquakes are especially likely when this weight decreases; water levels fell before the earthquake. This has not been proved according to scientific standards, but the assertion has appeared unchallenged a number of times in Science.

The same article says,

Seismologists have been collecting examples of triggered seismicity for 40 years. “The surprising thing to me is that you need very little mechanical disturbance to trigger an earthquake,” says [seismologist Leonardo] Seeber [of the Lamont-Doherty Earth Observatory in Palisades, New York]. Removing fluid or rock from the crust, as in oil production or coal mining, could do it. So might injecting fluid to store wastes or sequester carbon dioxide, or adding the weight of 100 meters or so of water behind a dam.

National and international differences
US regulations vary by states; here is a partial list.

The European Union has a set of recommendations rather than requirements, due to UK opposition to the latter. I haven’t found an overview that tells me what assertions are actually valid.

United Kingdom regulations differ a bit from those in the US:
• tighter regulations on well linings to protect the aquifer.
• fewer chemicals in the injected water.
• the collected flowback cannot be stored in open pits, which can lead to surface water contamination, but must be stored safely.

More information on the chemicals and and flowback storage can be found at the UK Department of Energy and Climate Change.

Fracking in temporarily on hold in the UK, but industry is optimistic that it can begin fracking soon.

Update 7/4/2015: From The Guardian, nine county councillors rejected fracking. Cuadrilla will appeal, but prospects look poor.

It’s about climate change
I have talked to and read a number of people in climate change, and they give one of two answers when asked about fracking. Either

fracking is good because it allows us to produce natural gas cheaper than coal, and that allows a rapid decrease in greenhouse gas emissions from electricity. Or

fracking is bad because it opens a large new source of fossil fuels, and it replaces low greenhouse gas forms of energy like nuclear power.

Every expert I have talked to or read provides one or both of those answers when asked about fracking. No other concern comes close to their concerns about the effect of fracking on climate change. Not the arsenic in the water, earthquakes, nothing.

My debate on global warming

March 19th, 2015

I participated in a debate: Observed global warming has not been proved mainly anthropogenic.

I am posting this so that any with ideas for improvements can share. Debating this topic is probably a total waste of time—that is my current thinking, and was before I decided in a moment of lunacy that a debate might generate useful discussion among those who accept mainstream science but are not motivated to act. But just in case there are better ways to handle it, please share. In this case, those who supported the assertion (not been proved) are libertarian leaning. An evangelical audience has different concerns. (Several people claimed to change their mind based on the debate, but they appeared to be changing to what they had believed all along.)

Format: we each get 6 minutes to introduce our ideas, 3 minutes to rebut, an hour for people to share their thinking, and 3 minutes at the end for a summary statement.

My Introduction

Science starts with observations. From there, scientists produce as many explanations as they can for what they see. These explanations provide models that make predictions. If the predictions fail, scientists rework or discard the models. In the case of global warming, for 2 centuries physicists have been discussing the models, based on data that goes back much further.

If you wish to dispute current thinking, you, like scientists, will need to both explain the errors for the last 2 centuries of physics, and propose alternative explanations. So what is the current thinking? The following 3 facts are incontrovertible.

Fact 1: We know Earth is warming.

Fact 2: We know which gases hold in heat, and that these greenhouse gases are increasing in proportion to our use of fossil fuels.

Fact 3: We have multiple lines of evidence showing the increase in gases and the warming are related.

So let’s take a look at those 3 facts.

Fact 1: How do we know Earth is warming? We know it from direct measurements of land and water, from shifts in where animals and plants live, from rapid increases in glacier and ice sheet melt, from sea level rise (due less to melting ice, and more to expansion as the water warms). And since the 70s, satellite data shows more heat into our atmosphere than out.

It’s true that the temperature varies year to year with volcanoes (colder), La Ninas (colder), and El Ninos (warmer), but the trend is up, and currently Earth is 1.6°F warmer, most of that gain in the last 1/2 century. Indeed 2014, an El Nino neutral year, was warmer than 1998, the strongest El Nino on record, as temperatures currently rise 0.3°F/decade. The oceans show this warming even more dramatically; 90% of the extra heat is stored there. Sea level was essentially stable for centuries, then rose 5” in the first 90 years of last century, and is now rising at the rate of 15”/century.

Fact 2: We know which gases hold in heat, and that these greenhouse gases are increasing in proportion to our use of fossil fuels.

By the middle of the 19th century, we knew that carbon dioxide and methane keep Earth warmer. These gases are in our atmosphere naturally, but they are also released by our use of fossil fuels. In the mid-20th century, it was shown that the ocean wasn’t absorbing all of the CO2, as most scientists had expected. Scientists also found the ratio of carbon isotopes in the atmosphere to be changing over time due to our use of fossil fuels. Today, carbon dioxide, the most important GHG, is 400 ppm in our atmosphere, up 40% from pre-industrial times.

Fact 3: We have multiple lines of evidence showing the increase in gases and the warming are related.

Hard evidence was found in history seen in ice cores. The Air Force studied the atmosphere in the Cold War to make heat-seeking missiles. Understanding has been checked against other planets and moons with atmospheres. That spectroscope shows which kind of light is present, but also, what is missing—when satellites in the 70s began looking at energy leaving Earth’s atmosphere, they found huge chunks of energy missing which show signatures for carbon dioxide and the other greenhouse gases, and these missing chunks become larger as we add more greenhouse gases. Then in the 80s, the ice cores showed rapid change in the past, not as rapid as we are inducing this century, but change didn’t have to take millennia as was once thought.

The models successfully predicted what we are seeing today. 19th century predictions include:
• carbon dioxide and other greenhouse gases warm Earth, and how fast.
• warming would be larger at night and in the winter.
• Polar regions would warm faster, and the Arctic faster than the Antarctic.

Predictions continued successfully into the 20th and 21st centuries.

There wasn’t much interest at first in these predictions. First, there was conventional wisdom, the ocean had been buffering change for centuries, and scientists couldn’t believe that it wouldn’t continue. It took one century to overcome this belief, when measurements were first made in the mid-20th century. Also, having overcome religious ideas of sudden change, scientists expected change to always be slow. Another was that the amount of carbon dioxide needed to see an effect seemed inconceivably large in the 19th century.

Social scientists say that when we don’t like solutions, we deny the problems. But the problems are real. Climate change is already seen as serious, and the current model predicts it will get a lot worse.

• As predicted, or faster than predicted, we are seeing shifts in rain and declines in food production. This will continue. On our current path, NASA says that by mid-century much of North America will move into megadroughts, worse and longer lasting than the Dust Bowl era.

• Sea level rise of 15’ or more due to Antarctica melt alone look inevitable, although it may take a couple of centuries or more or much more. Or it may not take that long.

• By the time today’s teens are in their 80s, or maybe even in their 60s, we may see as much change as between an ice age and the interglacial periods. Instead of people not being able to find places to live because of ice 1 mile thick over Wisconsin, they won’t be able to find places to live because of sea level rise, and much of the world becoming too hot or dry for humans or for our agriculture.

We’ll soon know whether these predictions, like so many others, will come true. I prefer that we act early enough so that we never learn.

Concern about climate change has come from many quarters: the insurance industry, Olympians in winter sports, the beer and coffee industries, worried about hops and coffee, Nike and Coke, worried about water and other ingredients, the national security types, worried about climate change enhancing other problems, and making one heck of a lot of Bangladeshis move.

It seems to me more than perverse not to pay attention to the knowledge we have spent so much time, money, and effort obtaining.

My Summary

The last two centuries of physics has tested the premises of the greenhouse effect and the prediction that our use of fossil fuels would heat Earth. It required improvements in spectroscopes and other equipment, improvements in the theory, finding confirmation in the past and on other worlds. It also required us to confirm that the oceans wouldn’t protect us, that change can happen relatively suddenly.

Other explanations offered tonight do not explain the observations, including the energy missing when it leaves Earth, right where the greenhouse gases are absorbing it. Yes, you will always find OJs who continue to seek whose glove was found, more tests are needed!, but these people have not offered alternative explanations and found errors in mainstream thinking.

Civilization developed during a time of enormous stability in the climate. Food could be grown in the same area for centuries with good cultivation methods. Large cities could mostly exist for centuries or millennia without needing to move buildings, roads, ports, and other infrastructure. Currently, we depend on that stability when we make decisions. That stability is being taken away…

We are confronting major costs to our way of life, and if we are foolish, we threaten it completely. And in response, some say, well do more tests, we don’t know enough yet. (Cover eyes and ears.)

This is about us, facing our responsibility, without getting so freaked out that we don’t want to act. It is a challenge to face such scary predictions and feel so helpless to make a difference. But accepting facts is where we begin the journey to meaningful action.

Challenges Made by the Hasn’t-Been-Proven Crowd

Those who assert that global warming has not been proved, both the main speaker and those who commented later, made a number of claims. There were too many to rebut all of them in the time allotted. I will provide links to responses, whether the response was provided in the debate or not.

• Earth has warmed only 0.6°C, and warming stopped in the 40s, although GHG emissions rose after that.
—Here is NOAA’s report from February 2015.

• IPCC has a history of being politicized, and skeptical scientists claim to be censored.
—Insufficient details provided, so no response provided.

• Most scientists are paid by the government and are therefore untrustworthy. I assume that the speaker is including state universities, where most climatologists work. This speaker put forth as an alternative the work of Willie Soon, who has been paid more than $1 million by fossil fuel interests.
—This meme arose during the Bush Administration, and so is doubly strange. It is true that most scientists around the world who work on climate issues do work for their government, in a variety of states, in a variety of countries. However much of the original work was done by rich people who didn’t need to be paid.

• The term denier is offensive.
—No one else used this term besides the speaker.

• There has been natural climate change in the past.
—Natural climate change doesn’t disprove anthropogenic change today any more than natural death disproves murder.

• Another person mentioned the Little Ice Age and the Medieval Warm period.
—The same answer holds, that previous natural climate change doesn’t disprove anthropogenic change today.

Scientists ascribe the causes of the Little Ice Age to increased volcanic activity and a cooler sun.

During the Medieval Warm Period, the North Atlantic was warmer than usual, but the planet as a whole was not.

• The media treat the science as settled, and generate false urgency.
—Doesn’t show that the media are wrong.

• Some hard to follow graphs were provided to show that the sun is actually the main driver of global warming, a much better fit to the data.
This appears to be one of the graphs. The idea that it is solar is addressed here.

• Or it could be cosmic rays.
Nope

• Scientists are wrong because they created a big scare over global cooling in the 1970s.
—Some of the media did, but most? all? scientists who brought up cooling were warning about an ice age in thousands of years.

• 2014 not the warmest year, the record has been flat.
—Here is NOAA’s report from February 2015.

• The increase in CO2 could be volcanoes.
—For this argument to be meaningful, the speaker must accept the importance of increasing atmospheric CO2.

It doesn’t really show up much in the Keeling curve, even though Mauna Loa is a volcano.

USGS addresses the importance of volcanoes to added atmospheric CO2.

• Models are wrong.
—Scientists say all models are wrong, some are useful. The biggest problem seems to be for ice sheet melt, in the discrepancy between the paleoevidence and the models, with models producing rates of melting far below both the paleoevidence and current observations.

• People have forgotten the alarmist projections of computer models.
—Insufficient details provided, so no response provided.

• Scientists are lazy, unwilling to buck the system.
—Buck the system successfully and one gets a Nobel. Interestingly, none of those who opposed the anthropogenic argument were willing to confront an ally on purported facts, such as the lack of warming since 1940.

• Temperature increase in the paleo-record comes first.
—That is true. There was temperature increase due to orbital changes, which led to CO2 increase which led to greater warming.

• Scientists are wrong, all of them, in asserting that their evidence is valid. It is only possible to ascertain if CO2 heats Earth with a large set of Earths a la medical research, and statistics.
—One type of response some wonks give to this kind of argument is, “Wow, no one in physics ever considered that idea.” This is not intended as a compliment.

• The solutions are bad and costly.
—If we don’t like the solutions, we often deny the problems.

Conclusion

I still want your ideas—What might have worked better with this particular audience? Or just give it up?

Tax or cap and trade?

February 27th, 2015

As per a previous post, adding a cost to greenhouse gas emissions is more effective than direct subsidies in reducing greenhouse gas pollution. However, many in the public, and many economists, are divided over how to implement that cost, and what to do with the revenue.

Terms explained

These terms will be used in the following discussion.

• A tax charges a set amount for every unit of pollution. Businesses find a tax easy to plan around, although the decrease in pollution is harder to predict.

Note: I have heard economists sometimes use the term tax to refer to a cost of any kind.

• Cap and trade sets a cap on pollution; this can be a total cap, or in one or more sectors (e.g., electricity or transportation). The cap determines how many permits to pollute are allocated or/and sold. Industries finding pollution abatement expensive buy extra permits, those finding it cheaper sell. The pollution goal is known, but the cost of permits is harder to predict, and to plan around.

• A hybrid cap and trade system starts with cap and trade goals, then limits wild swings in permit prices. One method is to set a floor or/and ceiling on permit prices. This limits price variability, but interferes with cap and trade goals. This system is hybrid because it acts like a cap and trade system if prices are in the range expected, but becomes a set tax if not.

Another method to reduce price swings is intertemporal banking of permits—depositing permits today if prices are low, because of mild weather, perhaps, or borrowing permits if prices today are high. (Lawrence Goulder discusses intertemporal banking further in Using Cap and Trade to Reduce Greenhouse Gas Emissions.)

Hybrid cap and trade systems use a floor or/and ceiling on permit prices.

Earth is warming
Climate change has great costs —1. Earth is warming.

Bottom line

For years, these three approaches for adding a cost (tax, cap and trade, and hybrid) have been used and studied. Meanwhile, some in the public have fought for a particular method because they see it as better or more politically attainable. Economists see fewer differences among the plans if they are well-designed.

Most important, all three add a cost to greenhouse gas emissions. Where there are differences, the tax and the hybrid cap and trade methods appear better. Then value judgements come in, e.g., is it more important to come closer to meeting climate reductions goals, or to make business planning easier? The differences between methods are minor. Rather than arguing for one or against another, economists feel we should argue for a cost.

There are a number of ways to allocate income from the tax/permits. It can be costly to the poor or businesses if they don’t get some of the money. Too much money to either business (e.g., from free permits) or returned to the public can raise the costs of addressing climate change. Economists prefer that much of the income from carbon pollution displace other sources of income seen as distortionary, such as income, payroll, and sales taxes, because that decreases the cost of addressing climate change. (An explanation of market distortion due to taxes can be found here.)

The details of allocating the income are tricky, involving social equity, burdens to business, calls to fund other programs (whether related to climate change or not), investment in the future through investments in energy research and development, and decreasing the cost to society by replacing other taxes. In the public discussion of allocation, too many of these issues are not addressed.

Most of what is discussed below comes from a paper, Carbon Taxes versus Cap and Trade: A Critical Review, by Lawrence Goulder, who served as vice-chair of California Environmental Protection Agency Market Advisory Committee, and Andrew Schein.

The overview indicates that there is relatively little difference between the tax and cap and trade programs in most ways seen as important in the public discussion, such as what happens to the revenue, and the use of offsets. There are a number of areas which have received little attention where differences do show up, such as how the U.S. plan would coordinate with decisions elsewhere.

This is from table 3 in the comparison paper, and summarizes the issues to be discussed:

Issue Carbon Tax Hybrid Pure
Cap and Trade Cap and Trade
Minimize Administrative Costs x
Avoid Price Volatility x x*
Address Uncertainty
——price vs emissions x x
——flexibility to new information x x
Avoid Leakage from "Nested" Regulation x x*
Avoid Wealth Transfers to Oil-Exporting Countries x x*
Achieve Revenue-Neutrality
Promote Broader Tax Reform x
Achieve Linkages across Jurisdictions ? ? ?
Achieve Benefits from Broad Sectoral Coverage ? ? ?
Achieve Greater Political Support ? ? ?

Notes: * applicable when the price ceiling or floor is engaged. X indicates relative advantage, ? indicate that the relative advantage is uncertain. The discussion below appears more nuanced than the table indicates.
Read the rest of this entry »

Why add a cost to GHG instead of subsidizing renewables?

February 3rd, 2015

Currently, the U.S. pays wind producers 2.3 cents/kWh. The federal government pays 30% of the cost of solar panel (photovoltaic, or PV) installations, and allows rapid depreciation—one solar manufacturer says this reduces the cost of installed systems by 70 – 75%. Additionally, a number of states subsidize wind, either through mandating renewables, as California does, or through direct subsidies. For example, windy Iowa adds another 1.5 cent/kWh for wind, as well as exempting wind from taxes. States subsidize solar purchase, as Iowa does, and mandate solar, as Minnesota does (1.5% of electricity by 2020). California is in a class by itself among states without huge hydroelectric capacity, mandating 33% renewables by 2020. In addition to purchase subsidies, California is one of a number of states using net metering (paying solar producers the retail value rather than the wholesale value of their electrons).

Do these subsidies really help, or are there better ways to reduce greenhouse gas (GHG) emissions? At the bottom, I partially address solar subsidies. This post focuses on why economists generally prefer correct pricing to subsidies.

Bottom line

Failing to pay the costs of pollution is not free; we still pay for pollution, but indirectly. Pollution costs us trillions of dollars each year, averaging about $500/person, although those who use more fossil fuel energy are more responsible. Increasing the price by that cost encourages us:

• to switch to technologies and behaviors that pollute less, and
• to waste less.

Subsidies and mandates for renewables often, not always, lower pollution, but at a higher cost. Subsidized energy displaces the most expensive energy, which is not always the most polluting energy. Additionally, subsidies don’t encourage building where it will do the most good—as discussed below, the location chosen to build a windmill may well be different if motivated by correct pricing of fossil fuels rather than subsidies/mandates.

Raising the price for energy could hurt the poor, but proposed plans cover the extra costs of the poor and middle class, at least, by returning money independent of consumption. On the other hand, pollution subsidies (failure to include the cost of pollution in the price) go disproportionately to the rich. The poor are expected to suffer disproportionately from climate change as they suffer disproportionately from pollution.

This analysis discusses pollution costs from greenhouse gases (GHG), but ignores substantial costs from other pollutants. This is partly because it’s easier to add a cost on carbon dioxide, as we know how much CO2 is released per unit of energy and so have an idea how much damage it will do. Less is known about particular plants: how much of other pollutants they produce, and what damage those pollutants do.

Introduction

If we don’t like the pollution from coal and other fossil fuels, why not just subsidize what we do like? Well economists have some reasons…

We really should pay the costs of pollution

Fossil fuels produce enormous amounts of pollution, and as long as we burn them, as long as we use the atmosphere as a sewer, the costs of pollution should be paid by the polluter. Those who fly or drive, or use coal or natural gas or other fossil fuels for electricity and heating, are incurring a cost, but not paying the cost. We see it in countries such as Saudi Arabia, where people pay only 1/5 of the cost of energy, that people overconsume when they aren’t charged a fair price, and the public money is less available where it is needed. So too do others pay the costs of pollution, including climate change (lives lost, health costs, lower yields for agriculture, increased storm damage). And when costs are artificially low, people forget we can insulate, turn off the lights, use fuel efficient cars, and take the bus—we are wasteful.

How much damage do fossil fuels do, subsidized by the rest of us?

As discussed in an earlier post, the current social cost of fossil fuels is $41/ton carbon dioxide; many respected economists argue it should be higher. All agree that it will rise over time. International Monetary Fund says the air pollution cost, not counting greenhouse gases, averages $57.50/ton of greenhouse gas (even though it’s not the GHG damage they are looking at).

I have seen no plans recommending incorporating damages from non-climate air pollution into the costs of using fossil fuels. One reason may be the complexities. Carbon dioxide does equal harm no matter where it is emitted, and the amount of pollution can be readily calculated from the amount of fuel. Other air pollution varies by plant, and the effect of that pollution varies with location and weather.

Regulation

It does not always make sense for regulators to put a cost on pollutants. Adding a cost is usually cheaper than direct regulation, as long as emissions are easy to monitor. On the other hand, regulators would would have to deal with too much information to make good and timely decisions about what to charge for leaking natural gas (methane). Where monitoring is difficult, regulation may achieve the same goal more cheaply. In the case of natural gas leaks, infrared cameras can detect the existence of a leak cheaply, and the cost of fixing the leak is often paid for by the value of the gas saved.

Subsidies for renewables are not good at reducing greenhouse gas emissions, part 1

Suppose you have three sources of electricity:

Source Variable operating cost ($/MWh) Cost of emissions ($/MWh) Variable social cost ($/MWh)
Wind $0 $0 $0
Coal $20 $23 $43
Natural gas $30 $11 $41

Notes: $10/megawatt hour = 1 cent/kilowatt hour. The variable social cost includes both the operating cost (private cost) and the cost of greenhouse gas emissions. In this example, the price paid to pollute is about $20/ton GHG emissions (half what economists argue for). The phrase variable social cost sometimes includes unpaid costs as well.

Let’s assume in this simplified example that those providing power bid (offer) the variable cost, the cost of fuel, workers, etc. for the electricity, as the price at which they will sell electricity. They don’t included fixed costs, such as the cost of the plant. Selling price is the highest bid price of all electricity actually bought. If wind only is needed, utilities pay $0/MWh. If coal is also needed, the wholesale price rises to $20/MWh, 2 cents/kWh, and both wind and coal providers are paid that rate. If even more electricity is needed, natural gas is brought online and utilities now pay 3 cents/kWh to every supplier. Clearly, there is a fixed capital cost not included in the variable cost; power suppliers cover this portion of their cost when the selling cost of electricity is greater due to other sources being brought online, for example, expensive peak power for high demand periods. In addition, wind is directly subsidized.

If instead of subsidizing wind, fossil fuels paid $20/ton-CO2 of their pollution cost, then natural gas would be brought online first after wind, at a cost of 4.1 cents/kWh, paid to both wind and natural gas providers. If more electricity is needed, then coal is brought online, and all are paid 4.3 cents/kWh.

To summarize, subsidized wind displaces the more expensive natural gas. If instead, a sufficient greenhouse gas cost is added, wind now displaces coal. Economists say that adding a cost is more efficient at reducing GHG emissions.

Subsidies for renewables are not good at reducing greenhouse gas emissions, part 2

Suppose there are mandates to build wind, perhaps through renewables portfolio standards. Or there are direct subsidies, perhaps for each MW of wind built, or MWh produced. You the entrepreneur are looking at two locations. In each location, the capacity factor is 30%, that is, over a year, windmills produce 30% as much electricity as they would if they ran 24/7 at full tilt. In one location, more power is produced at night, in the other, slightly more electricity is produced during the day. With a direct subsidy, neither location appears to have an advantage.

If the wind decision is made after a cost is added to GHG emissions, it makes sense to add wind where GHG reductions are greater. In California, night electricity is disproportionately nuclear; in Pennsylvania, it is coal. The more expensive electricity during the daytime in both PA and CA, the one that would go offline if the wind blows, is natural gas. All else being equal, it is better to build windmills where the wind blows at night in PA, and during the day in CA.

Sometimes renewables subsidies are largely a waste of money. Because of renewables mandates, California builds wind in the Pacific Northwest. There, especially in the spring, wind competes with hydro. Some 40% of Danish wind backs up Norway’s hydro. Neither reduces GHG emissions.

Washington wind
Wind in Washington state

Note: wind, solar, and nuclear don’t play the same role in electricity supply

Nuclear power provides baseload electricity, the minimum electricity required during the day. It doesn’t ramp up and down as demand changes. Solar helps with the increased demand during daylight. From the examples above, it is clear that wind is most useful where there is fossil fuel baseload power, which then ramps down when the wind blows. Neither wind nor solar can supply baseload power, because they are not available 24/7, and solar cannot even be depended on during the daytime in most locations.

What about the poor? They don’t want to see the cost of energy go up.

Although this argument may be made most often by those with enough money who don’t want to pay more themselves, the argument has merit. If the price of energy increases, it will hurt those operating on tight budgets. Yet legislative proposals to date make sure the poor don’t suffer:

• All proposals for adding a cost to greenhouse gas emissions include refunding some (or all) money to consumers, a dividend independent of use. This refund would be high enough to compensate low-income consumers for price increases. Unlike direct subsidies for heating oil or other forms of energy, the rebate encourages me to reduce my own energy use, although it is sufficient to cover increased costs completely for low-income energy users.

• Subsidies currently go disproportionately to those who drive and fly more, and use considerably more electricity and heat, namely, the wealthy. Those who are poor or who have other health problems are more likely to pay these subsidies with their health.

• The poor will pay disproportionately for climate change. Not addressing climate change as rapidly and as cheaply as we can does the poor no good.

But aren’t subsidies better than nothing?

Subsidizing renewables is better than doing nothing.

But doesn’t it make sense to subsidize renewables to bring down the price?

Economists do support targeted subsidies, along with heftier funding of research and development. Carbon capture and storage is often cited as an important energy source needing deployment subsidies, and research and development. Similarly, new nuclear gets the same production tax credit as wind, although only for the first 6,000 MW of new build (about 5 reactors). This is because costs go down with learning—there is evidence that the 2nd reactor at Vogtle will be cheaper than the 1st. The fourth reactor of the same kind may be 20% cheaper than the first.

But what about solar subsidies?

Economists generally support pricing fossil fuels correctly over subsidizing better alternatives to fossil fuels. They sometimes support subsidizing solutions, e.g., solar and carbon capture and storage, in order to bring down the price, as a long term strategy. As discussed, solar electricity helps with a different niche than nuclear does—solar helps imperfectly with increased demand during the day, while nuclear supplies baseload power.

While economists at International Energy Agency and elsewhere agree that our current method of subsidizing solar is not sustainable, I have not seen alternative methods suggested, nor have I seen an analysis of how much subsidies make sense for how many years. (Please send me to analysis addressing either of these two questions.) And subsidies would need to be large for quite a while—a 2013 look at The Economics of Solar Electricity found the cost of south facing solar panels at a good angle ranged from 19 cents/kWh in Tucson to 26 cents in San Francisco to 29 cents in Boston and Trenton, with prices much higher if the panels don’t face south or if the angle is worse. (Solar actually costs more, as some costs were not included.) U.S. solar displaces natural gas, which wholesales for about 7 cents/kWh. The price of solar has dropped quite a bit with the shift to large manufacturers, and prices will drop further as soft costs (costs of purchase other than hardware) also fall. Still, it it will be a while before solar becomes cheaper than nuclear and fossil fuels.

Renewables subsidies have been more open-ended and larger than other subsidies to deploy energy in the richer countries. Do they make sense? I will post when/if I understand the issues.

The series:
Fossil Fuel Subsidies
Can we address climate change fairly cheaply?
• Why add a cost to GHG instead of subsidizing renewables?
Tax or cap and trade?

Can we address climate change fairly cheaply?

January 31st, 2015

Introduction

Several people, including Paul Krugman in Could Fighting Global Warming Be Cheap and Free? have made assertions such as,

This just in: Saving the planet would be cheap; it might even be free. But will anyone believe the good news?

Here is a look at these claims, what they tell us, and what they don’t.

Bottom line

smog in India
Smog in India and other countries has grown dramatically in recent years, and so have the numbers of dead and ill.

Air pollution and mind-deadening commutes harm us as individuals. They also contribute to decreased economic productivity. Around the world, millions die yearly from outdoor air pollution, and coal in particular, damages individuals and economies.

Two studies from 2014 say that the costs of addressing climate change are not so large if we count co-benefits: when we reduce carbon dioxide pollution, we almost always reduce air pollution, for a healthier population. This is a point that Intergovernmental Panel on Climate Change has made in their reports on mitigation (reducing the sources or increasing the sinks for the causes of climate change). If we end direct subsidies to fossil fuels (mostly in the developing world), and indirect subsidies (such as our health and agriculture yield), then the extra costs to address climate change are fairly low.

The idea of co-benefits is crucial, that we could and should do a lot better, that addressing air pollution is in countries’ self-interest (a healthier population is a more productive population), are messages that we hope to hear more often.

That said, we pay to reduce greenhouse gases and other air pollution with higher energy bills, even if these reductions save us money, and transitions will be complicated. “Almost free” policies to address pollution add a price to energy of many tens of dollars/ton carbon dioxide.

First report, from the International Monetary Fund

A working paper of the International Monetary Fund says 3 million people die yearly from coal (some due to indoor air pollution), and 3.7 million die yearly from outdoor air pollution. Air pollution other than greenhouse gases, and congestion from incorrectly priced fuels, cause an extra $57.50 in damage per ton of carbon dioxide, even though it is not the CO2 doing the damage. IMF recommends eliminating fossil fuel subsidies, and adding a carbon price in the top 20 emitting countries. Prices would vary, from more than $80/ton in Poland, where CO2 comes disproportionately from coal and public exposure is high, to less than $20 in South Africa and Australia, where exposure is less. (South African coal plants are on the coast, so damages are lower although coal use per capita is higher than in the United States.) In the U.S., the tax would be $36. Note: each $10/ton CO2 cost adds about 1 cent/kWh to the portion of electricity from coal, half that to the portion from natural gas, and 9 cents/gallon to gasoline.

IMF would tax all fossil fuels independent of their effects on air pollution, so the tax on natural gas would be half that for coal, even though air pollution is much lower. Presumably IMF prefers this method because assessing air pollution damage caused by each power plant is a challenge. Some of the avoided deaths come from fewer automobile accidents as driving costs rise. Benefits include reduced traffic congestion and road damage. About half of the savings is due to a tax on fossil fuels (directly via tax, or indirectly via cap and trade) displacing less efficient taxes, such as income, sales, and payroll taxes.

Health benefits would be higher in the developing world. Additionally, fossil fuel subsidies are mostly in the developing world, and mostly in energy exporting nations, where they do immense economic damage. Transition costs would be higher in most of the developing world as well.

Second report, from Global Commission on the Economy and Climate

The Global Commission on the Economy and Climate, a group of political and financial leaders from around the world, analyzed co-benefits in Better Growth, Better Climate—The New Climate Economy Report. The Executive Summary stresses the importance of acting immediately, as we can be locked in for decades to decisions made today. Over the next 15 years, $90 trillion will be invested, and population will grow another 500 million, so delay will be costly. They emphasize that all countries, not just the wealthy, can benefit from more holistic decision-making:

The report’s conclusion is that countries at all levels of income now have the opportunity to build lasting economic growth at the same time as reducing the immense risks of climate change. This is made possible by structural and technological changes unfolding in the global economy and opportunities for greater economic efficiency. The capital for the necessary investments is available, and the potential for innovation is vast. What is needed is strong political leadership and credible, consistent policies.

Some caveats

Neither report discusses, so far as I can see, the following:

• How many human lives could be saved by cheaper methods, such as scrubbers, rather than focusing on improving human health through solutions which have co-benefits for the climate? Additionally, natural gas contributes half as much to global warming as coal, but natural gas air pollution kills many fewer. Benefits to the climate are about equal in switching from coal to natural gas, and from natural gas to nuclear, but most of the co-benefits occur with the switch away from coal.

• How will current world leaders continue in power while eliminating fossil fuel subsidies, which have transition costs in addition to political opposition? Finding a way to help the poorest, who get a relatively small amount of the subsidy, eases the transition. A number of countries have seen turmoil when the attempt has been made. (Note: I wish well all those going through the transition, and hope that they make rapid progress!)

Another view—Stavins says the economics of addressing climate change is “difficult, not impossible”, and the politics are even more challenging

Robert Stavins, a lead author on three IPCC reports, expressed the idea of cost much differently in a NY Times op-ed, Climate Realities. He doesn’t address co-benefits, but says that addressing climate change will be difficult and expensive, and may even be very, very expensive:

Two points are important to understand if we’re going to be serious about attacking this problem.

One, it will be costly. An economic assessment might be “difficult, but not impossible.” And two, things become more challenging when we move from the economics to the politics.

Doing what is necessary to achieve the United Nations’ target for reducing emissions would reduce economic growth by about 0.06 percent annually from now through 2100, according to the I.P.C.C. That sounds trivial, but by the end of the century it means a 5 percent loss of worldwide economic activity per year.

And this cost projection assumes optimal conditions — the immediate implementation of a common global price or tax on carbon dioxide emissions, a significant expansion of nuclear power and the advent and wide use of new, low-cost technologies to control emissions and provide cleaner sources of energy.

If the new technologies we hope will be available aren’t, like one that would enable the capture and storage of carbon emissions from power plants, the cost estimates more than double.

Then there are the politics, which are driven by two fundamental facts.

First, greenhouse gases mix globally in the atmosphere, and so damages are spread around the world, regardless of where the gases were emitted. Thus, any country taking action incurs the costs, but the benefits are distributed globally. This presents a classic free-rider problem: It is in the economic self-interest of virtually no country to take unilateral action, and each can reap the benefits of any countries that do act. This is why international cooperation is essential.

Second, some of these heat-trapping gases — in particular, carbon dioxide — remain in the atmosphere for centuries, so even if we were to rapidly reduce emissions, the problem would not be solved immediately. Even the most aggressive efforts will take time to ramp up.

These realities — the global nature and persistence of the problem — present fundamental geopolitical challenges.

Andy Revkin from Dot Earth

Revkin from the NY Times quotes Dave Roberts in A Climate Hawk Separates Energy Thought Experiments from Road Maps, while saying that a lot can go wrong between the figuring of the costs and the actual expenditures, and it is quite reasonable to expect they will be more expensive than IPCC estimates.

It’s great to have these studies in our back pocket, as they refute the conservative mantra that a clean-energy transition is impossible. It is possible. But possible is a long way from practical or likely, and farther yet from “cheap” or “easy.” Let’s not fool ourselves about the huge task ahead.

My understanding of IPCC’s report on mitigation

There are two big numbers to pay attention to when we look at the cost of mitigation. (The costs of adaptation also rise rapidly with failure to rein in greenhouse gas emissions.)

First, many economists assume that world GDP continues to rise perhaps 3% per year through the end of the century. The assumption that GDP continues to rise in a changing climate, or that it continues to increase at a good rate, may be incorrect, according to some prominent economists. If economic growth falls a modest 1%, from 3% to 2%, then the time for GDP to double rises from 23 years to 35 years.

The second is the one discussed in all of the reports and articles above, actual expenditures. If we increase how much we pay out to mitigate global warming by 0.06%/year, then GDP still grows by 2.9%/year (if the 3%/year is valid). Economists have been assuming that a 5% reduction in 2100 means only that we reach the 2100 GDP in 2102 instead. It appears that some are now considering that the combination of reduced rate of GDP growth, possibly even negative growth, and greater costs than expected may mean that mitigation in 2100 is a hefty portion of the GDP.

IPCC says that costs to mitigate climate change this century will reach 5% of the GDP (forever) by the end of the century if all of these come to pass:
• GDP grows as fast as predicted so that the denominator used in calculating percent is large.
• We do everything right, such as adding a steep cost on greenhouse gas emissions everywhere, now, and increase energy research and development by a lot (e.g., a factor of 3 in the U.S.).
• Technology improvements come as rapidly as hoped for all sources of energy and efficiency, especially carbon capture and storage.
• Scientists are right about the amount of mitigation needed.

There are a number of ways that we can assure that the cost of mitigation doubles, or worse. Some will be discussed in the next two posts in the series.

Decades of delay in addressing climate change is costly:
• Adaptation costs are already higher today because of delay, and will be worse tomorrow.
• We will less wealthy in the future. The World Bank has issued a number of reports warning that a Warmer World Will Keep Millions of People Trapped in Poverty.
• Mitigation costs rise with delay—rather than implementing changes fairly rapidly, they need to be added much faster.

Economists do not doubt that the costs of living with change that we do little to prevent would be much larger. However, in discussing the costs of climate mitigation, even counting co-benefits, we may not want to use the term, cheap.

The series:
Fossil Fuel Subsidies
• Can we address climate change fairly cheaply?
Why add a cost to GHG instead of subsidizing renewables?
Tax or cap and trade?

Fossil fuel subsidies

January 28th, 2015

This is the first in a series of posts on the costs of addressing (or failing to address) global warming, and which policy tools work best: subsidies to other energy sources? tax? cap and trade? Writers frequently refer to fossil fuel subsidies, and I wondered how large they are. I begin with this, because if fossil fuels are not highly subsidized, either through direct subsidies or failure to require polluter to pay, there are no market distortions that need to be addressed.

[Notes: A market distortion is defined to be a situation where the price of the commodity does not make sense—it is higher or lower than it should be, so that decisions people make do not include full knowledge of benefits or damage. This is discussed in more detail below.

[People often leap to defend fossil fuel subsidies without checking whether their particular concern is addressed in policy solutions. These solutions will be discussed in coming posts.]

Bottom line

Largest subsidies: not requiring polluters to pay for air pollution ($1.6+ trillion/year) and climate change ($1.4 trillion+++++/year and growing). These are more commonly called externalities, costs or benefits going to those who did not pay for them.

Much lower are consumption subsidies ($400 billion), which lower consumer prices for gasoline, electricity, etc.

Lower yet are productions subsidies, which reduce costs for energy producers (perhaps $100 billion).

These subsidies average more than $500/year for every person on Earth. Those who use more fossil fuel energy receive more subsidies.

Production subsidies

Good statistics on production subsidies, which partially offset industry losses or costs, don’t exist.

To give an idea of their magnitude, Joseph Aldy asserts that almost $5 billion per year in US subsidies to fossil fuel producers, mostly oil and gas, are a waste of money. The Global Subsidies Initiative estimates world production subsidies may total $100 billion/year.

Consumption subsidies

Consumption subsidies reduce consumer prices. In Venezuela, gasoline is sold for 6 cents/gallon. In Saudi Arabia, oil is made available for domestic use, including electricity production, at under $15/barrel. In both Venezuela and Saudi Arabia, more than 3/4 of the price of fossil fuel consumption is subsidized.

International Energy Agency provides an analysis of fossil fuel subsidies, which disproportionately go to the rich and middle class, drain state budgets, increase pollution, distort markets, encourage waste, and discourage investment in methods to reduce energy use. Subsidies increased by $110 billion between 2009 and 2010, to $409 billion, to keep up with rapidly rising energy prices. IEA says consumption subsidies may reach $660 billion in 2020.

Subsidies are especially high in countries which export fossil fuels, more than $325 billion of the 2010 subsidies. Importers see their budgets suffer, and exporters see a valuable resource depleted more rapidly.

An IEA map shows consumption subsidies around the world—they are found in most of Asia, a good portion of Central and South America, and North Africa. These 10 countries subsidize the majority of the price of fossil fuels (percents vary with the price):

South America
• Ecuador (52%)
• Venezuela (82%)

Africa
• Algeria (57%)
• Egypt (54%)
• Libya (80%)

Asia
• Bangladesh (51%)
• Iran (74%)
• Iraq (62%)
• Saudi Arabia (79%)
• Uzbekistan (61%)

Pollution subsidies for global warming—polluter isn’t paying
climate risks are higher than estimated because they are erratic
Climate risks may be higher than estimated because they are erratic

Another market distortion occurs when we don’t include the costs of global warming, currently estimated at $37/ton carbon dioxide, $41/metric ton, for pollution emitted today. All agree the cost of keeping temperature increase manageable will rise.

This market distortion is called an externality, because the cost is external to the price. It effectively acts as a subsidy, with the purchaser paying far less than the actual cost.

[Notes: there is disagreement about the $41/ton CO2 estimate. A number of prominent economists feel it should be higher because economic models are insufficient:
• History tells us transitions will not be as smooth as economists predict.
• Productivity, productivity growth, and the value of buildings, farms, and infrastructure will decline. Additionally, threats from major conflict and societal and economic collapse are not included in current economic models.
• Ecosystems will collapse, making them a more valuable commodity.
• Economists explicitly discount the future more than scientists, often discounting it at a constant rate, even though we as individuals see more difference between today and a year from now, than between 20 and 21 years from now; scientists point out that this method discounts almost entirely the costs of global warming in a few decades, no matter how high.

[A recent analysis examines only the effect of the slowdown in economic growth and produces an estimate of social cost of carbon dioxide which is several times higher than $41/ton. International Energy Agency suggests a $46/ton CO2 cost in 2020, rising rapidly to $160 in 2050.]

In 2013, the world consumed 33 billion barrels of oil, releasing 0.43 metric ton carbon dioxide per barrel oil. The subsidy to polluters who use oil is

$41/ton CO2 x 0.43 ton CO2/barrel x 33 billion barrels/year = $600 billion/year

In 2013, the world consumed 7.8 billion metric tons of coal, each releasing 2 tons of CO2/ton of coal. The subsidy to polluters who use coal is

$41/ton CO2 x 2 tons CO2/ton coal x 7.8 billion tons coal = $600 billion/year.

In 2013, the world consumed 3,300 billion cubic meters, 120,000 billion cubic feet, of natural gas. Each billion cu ft produces 54,400 tons CO2. The subsidy to polluters who use natural gas is

$41/ton CO2 x 54.4 million tons CO2/billion cu ft x 120,000 billion cu ft = $250 billion

These total over $1.4 trillion.

Ignored in these calculations are significant contributions from methane (natural gas), black carbon, and other climate forcings.

Pollution subsidies for air pollution other than those causing global warming—polluter isn’t paying

Air pollution
Air pollution, indoor and outdoor, kills 7 million annually, according to World Health Organization.

A working paper from the International Monetary Fund looks at the top 20 CO2 emitting nations, responsible for 79% of world greenhouse gas emissions. These countries emitted 27.1 billion tons of CO2 in 2012. IMF says in these countries, air pollution other than greenhouse gases, and congestion from incorrectly priced fuels, cause an extra $57.50 in damage per ton of carbon dioxide, although the damage is not from the CO2.

$57.50/ton CO2 x 27.1 billion tons = $1.6 trillion

In 2013, 33 billion tons of CO2 were emitted from fossil fuels and cement, so even assuming lower pollution in other countries, subsidies due to polluters not paying the cost of their air pollution is likely higher.

Pollution subsidies are real market distortions

Poor countries are harmed when energy use is subsidized. The rich use more energy and get more benefit from the subsidies. The result is that in poor countries, other important needs of society, such as education, are shortchanged or even ignored. Once these subsidies are in place, it is hard to convince people to give them up since they look on them as a right.

People I talk to understand that direct consumptions subsidies harm countries, but say they cannot see that pollution subsidies are in any way unfair. They agree that the cost of pollution from fossil fuels has been estimated at $41 a ton, just for climate change. However, they say, too, this is not the real cost since it fails to take into account the benefits of cheap fossil fuel to society.

Unfortunately, failing to make the polluter pay exacts a high cost on society. The damage done by the polluter (without the polluter having to pay) has to be seen as a subsidy because in an undistorted market (where all costs are taken into account), the polluter pays for the cost of the damage along with the other costs of energy. In today’s world, climate change and air pollution affect people’s health and lives, and cost society. The costs can also be seen in increased costs to agriculture because of decreased yields due to floods and drought. There are other definite costs: costs when buildings suffer damage from sea level rise, storm surges and floods; costs when we have to take steps to protect ourselves from rapid climate changes; coats when we have to deal with the results of permafrost melt; costs when land loses value because of climate change. Economists may limit their assessment to the near future, but the damage we do today will continue to cost future societies for many thousands of years.

People use the price of fossil fuels in determining how much to buy, and they are priced too low, so we buy more than makes market sense. I have heard a number of economists call improperly priced fossil fuels “the greatest market failure ever”. Nicolas Stern says this as well,

The problem of climate change involves a fundamental failure of markets: those who damage others by emitting greenhouse gases generally do not pay…Climate change is a result of the greatest market failure the world has seen.

The series
• Fossil Fuel Subsidies
Can we address climate change fairly cheaply?
Why add a cost to GHG instead of subsidizing renewables?
• Tax or cap and trade?

Nuclear Power as a Solution to Climate Change: Why the Public Discussion is such a Mess

December 11th, 2014

Nuclear Power as a Solution to Climate Change: Why the Public Discussion is such a Mess, the talk I gave in Berkeley December 7, 2014, is on the web.

Comments?

Subsidizing renewables increases research and development

April 27th, 2014

The last post discussed Severin Borenstein’s findings that most justifications for renewables subsidies don’t make sense. David Popp’s Innovation and Climate Policy brings up a different reason, a market failure that might not adequately be addressed by simply pricing fossil fuels at a much higher level, to reflect their costs.

This post is California-centric. My state has invested heavily in renewables—is this a good choice, or can we do better?

Every major paper I’ve read on energy policy stresses the need for research and development (R&D), both government (basic research) and private investments (closer to market). This is necessary today so that tomorrow’s energy is cheaper. Every paper I have read on energy says that R&D needs to be increased significantly, that we will pay dearly tomorrow for failing to invest enough today. In an article on the hearing for current Secretary of Energy Moniz, the Washington Post provided more information:

Spending for R&D should be greater
The Washington Post looks at the level of investments in R&D in a number of charts; here, expenditures are well below International Energy Association recommendations.

Spending over time
We’re also spending much less on energy than in the 1970s. (Energy research funds doubled in real terms between 1973 and 1976, and almost doubled again by 1980. The Arab oil embargo began in October 1973.)

Federal R&D can be increased by direct expenditure (although we choose not to, much), but not so for private R&D. What to do? Popp says that using subsidies and mandates to make renewables more attractive today, more than they would be if a huge cost were added to GHG emissions, is important, because this leads to large private R&D increases, and is an investment in our energy future.

This may be, but I found his arguments unpersuasive. Let me know what I missed. I don’t know that Popp reaches conclusions that are wrong in any way, but that it may make sense to explore the issues more completely.

First, how much money goes to energy R&D?

US DOE R&D
This is the amount of R&D paid for by the Department of Energy (DOE), from 1990 – 2013, about $6 billion for energy in 2013.

Popp errs in saying that DOE 2008 energy R&D was $4.3 billion, and that 23% went to nuclear. The chart shows this is clearly not the case—Popp does not differentiate between fission (the current method) and fusion, decades in the future, or civilian and military research. Globally, Popp says, 39% of $12.7 billion went to nuclear, and only 12% to renewables. Looking at the numbers in greater detail gives a different picture. For example, while it is true that in 2005, over 40% of global energy R&D is fission and fusion, taking out Japanese research (mostly for its breeder reactor), and French research (Areva is government owned), total fission research in 2005 was $308 million, less than 1/3 that spent on renewables.

What should R&D focus on?

Is private R&D currently targeted in a way that makes sense? Where are the biggest deficiencies?

I did not see a treatment of this question. Severin Borenstein says that it is important for California to focus not just on reducing its own emissions, but finding solutions that are important for the world.

The number one solution in Intergovernmental Panel on Climate Change Working Group III, the number one solution in various International Energy Agency reports, is increased efficiency (in power plants, transmission and distribution, cars, heating and cooling, appliances, etc). Carbon capture and storage (CCS) is very high on the list of technologies for making electricity. This is because CCS can work with existing fossil fuel plants which are likely to be in operation for decades, and with industries such as steel which are energy intense but do not use electricity. Additionally, CCS can be used with bionergy to take carbon dioxide out of the air. Carbon capture and storage is not a source of energy but a number of methods that reduce significantly carbon dioxide released when burning fossil fuels or bioenergy.

There are a number of other low-GHG solutions, including nuclear, solar, and wind, and to a lesser extent, geothermal. By implying that the R&D budget for nuclear is already high, Popp appears to imply that it is sufficient. Even if an R&D budget is large, how do we determine what constitutes a sufficient funding?

• Size of the current and historical R&D budget, both public and private, is not the only criterion—huge amounts have been spent on solar panel (photovoltaic, or PV) R&D over the decades, and PVs still are not able to compete with fossil fuels or nuclear power without huge subsidies. PVs need more R&D than wind and nuclear to get to affordable—solar has greater R&D needs. How do we evaluate needs, and choose among sources? Does it make sense to consider wind and solar together?

• The role the solution will play in the future is also important, as is the timing of the solutions. International Energy Agency has been warning for years that CCS research especially needs to be done on a much faster time scale (see any executive summary of their Energy Technology Perspectives). How do we select among CCS, nuclear, and wind and solar power?

• Other states and countries are subsidizing some solutions—Germany today, and Spain in the past, are among a number of countries and states that have spent vast sums subsidizing renewables, so perhaps California might consider investing in other sources.

Does this method work particularly well compared to other methods of encouraging private R&D?

California has a long history of mandating technology change first. The first Environmental Protection Agency was here, so California has the right to set its own smog standards, fuel efficiency standards, etc. Thank goodness, because our smog standards were earlier, and more stringent.

We also have a history of programs to push the technology. California mandated electric cars in 1990, and participated in a partnership beginning in 2000 to encourage fuel cell buses, with both federal and state funding. What does economics literature say about the success for technology still far in the future? Are affordable solar panels near enough that private R&D is a good investment?

Are there other methods that would be more successful, such as funding research hubs, or giving grants to various R&D projects? Is there not yet enough history to choose among methods? (Presumably most or all work better than the current alternative of underfunding R&D.)

Summary

It is clear that U.S. governmental and private investment in energy R&D is too small. David Popp’s Innovation and Climate Policy discusses how to increase private investment, but insufficient information is provided about what economists know about encouraging R&D.

Of all the reasons to subsidize and mandate renewables, many listed in the previous post, the need to encourage private R&D makes the most sense. However, it seems to me important to treat a number of questions in more detail. These include:
• How much of our goal is to push R&D? to meet local needs vs global needs?
• How do we choose between CCS, nuclear, solar, wind and other clean energy technologies?
• Is this method of encouraging R&D likely to be most fruitful, or are there better alternatives?

Lightly edited for clarity

Most popular reasons for subsidizing renewables don’t make sense

April 27th, 2014

Intergovernmental Panel on Climate Change recently released a set of major reports. Working Group I said that we must limit severely the amount of greenhouse gases we release if we are to stay below 2°C increase over pre-industrial times. Working Group II discussed changes we will see, and could see, if we do not meet this goal. Working Group III said that if we make good choices about how to reduce GHG emissions, mitigation could be fairly cheap.

With that in mind, it makes sense to look at policies both in place and planned. One such policy is direct subsidies and mandates, an indirect subsidy, to renewables, particularly wind and solar. Wind and solar are expected to be important in the 2050 time frame, with solar and wind together expected to supply between 20 and 60% of electricity capacity, depending on the region, according to the 2012 International Energy Agency Energy Technology Perspectives. (Capacity refers to the amount of electricity that can be produced at maximum operation. Because wind and solar power have a lower capacity factor than nuclear or fossil fuels, their actual contribution will be much lower.)

Currently, the majority of U.S. states and a number of countries subsidize or/and mandate renewables. They usually subsidize capacity (paying per megawatt built) or electricity (per kWh), or require a set percentage of power to come from renewables (33% in California by 2020, although some can be built out of state).

Renewables include energy from hydroelectric (although some governments don’t count large hydro); biomass or bioenergy—generally agriculture waste and landfill gas, although future plans include dedicated crops; wind; geothermal; sun; and tidal or other forms of marine power. (Geothermal is not technically renewable on a human time scale, as wells tap out.) The sun is used to make electricity using two different technologies: making steam, which is then used in the same way fossil fuel or nuclear steam is used, and solar panels, or photovoltaics (PV). Renewables can be used for electricity, heat (particularly sun and biomass) or transport (particularly biofuels). These two posts will examine only renewables used for electricity.

In many places, renewables subsidies exist because they are politically acceptable, and solutions economists favor are not. Highest on economists’ list is adding a steep cost through a tax or cap and trade program. Upcoming blogs will examine why, and the differences between these. The current so-called social cost of fossil fuels, the cost society pays, but the polluter does not, is $37/ton carbon dioxide. (A number of economists say this is too low, and give wonk reasons to support their thinking. They say, in part, that “because the models omit some major risks associated with climate change, such as social unrest and disruptions to economic growth, they are probably understating future harms.” This short article is worth reading.)

Assuming we adopt a tax or cap and trade: will it make sense to continue subsidizing or/and mandating renewables? Economists ask: is there a market failure that cannot be addressed sufficiently by including the steep cost of greenhouse gas (GHG) emissions in the price, that will require other policy interventions? Internalizing a social cost of $37, adding 4 cents or so/kWh of coal power, about half that to natural gas power, makes renewables more attractive because fossil fuels are more expensive. However, the goal is not to make renewables more attractive, but to solve a number of market problems. Economists don’t see their goal as favoring certain solutions, but making the market work better by removing market failures. Of these, the most important is the failure to price fossil fuel pollution correctly.

Two papers I read recently look at direct or indirect subsidies to renewables. Severin Borenstein, in The Private and Public Economics of Renewable Electricity Generation, finds most arguments made in favor of renewables subsidies do not make stand up under scrutiny. (See next post for a discussion of the other paper.)

Wind is currently close to fossil fuels in price, but wind has several disadvantages (it is non-dispatchable, tends to blow more when it is less needed, and requires expensive and GHG-emitting backup power). While coal and natural gas do get subsidies, these are a fraction of a cent/kWh. Renewables get hefty federal subsidies, such as 2.1 cents/kWh for wind, and more for solar. [These are supplemented by state subsidies.]

What benefits of renewables are not addressed by adding a cost to greenhouse gases, and so justify subsidies to renewables? Borenstein looks at a number of assertions:

• Some renewables decrease pollution other than greenhouse gases, pollutants that damage human health (as well as ecosystems and agriculture).

This is an additional important part of polluter pay not being considered today. However, this cost to human health, etc. is more variable, and depends on population density, climate and geography. General subsidies for renewables would not make sense—subsidies must target power plants doing the most damage. That is not done today.

• Increasing the use of renewables will increase energy security, because the U.S. will produce more of its own electricity.

Since the U.S. uses U.S. coal and natural gas, U.S. rivers, and so on, this argument doesn’t seem to apply here (it might apply elsewhere). This argument could apply to oil imports, and electric cars, if they are successful, could replace imported oil. However, coal and natural gas are cheaper, they would be more effective than renewables in replacing oil in transportation, and renewables have no inherent advantage.

• Subsidies for renewables will lead to more learning by doing, and this will lead to lower prices.

However, this subsidy for renewables only is appropriate if society benefits rather than the particular company. And there appears to be little support that this oft-cited factor has been important to the decrease in solar panel prices over time. There is more support for evidence that technology progress in the space program and semiconductors, as well as an increase in the size of solar companies, has had more effect.

• Green jobs will follow, as renewables require more workers (or/and more workers among the unemployed and underemployed).

This statement has two components. There is uneven support for the idea that renewables and energy efficiency employ more people than other fields of energy. They may even target workers who have more trouble getting work, a social benefit. The longer term argument is that this will build a renewables industry, although evidence in Germany and Spain does not appear to support this idea. Studies might provide support for one or both ideas.

• Lower costs for fossil fuels will follow decreases in the cost of competing forms of energy.

The evidence for this is scarce.

Summary

The main justification discussed so far for renewables subsidies over adding a cost to greenhouse gas emissions appears to be that society allows subsidies and does not allow a tax. The next post will examine an additional reason, the role subsidies play in increasing research and development.

IPCC on Mitigation: Which technologies help reduce GHG emissions the most?

April 16th, 2014

Intergovernmental Panel on climate Change Working Group 3 (Mitigation) has produced their update from 2007. This post looks at electricity technologies.

Summary, also comments
• Improving efficiency much more rapidly in all sectors (energy production, distribution, and use) is crucial.
• Carbon capture and storage (CCS) is the single biggest addition to business as usual, if our goal is to keep atmospheric levels of CO2-equivalent below 450 ppm, or even 550. Plans for research and development, and deployment, should proceed rapidly and aggressively. (This will be aided by adding a cost to greenhouse gas emissions to cover their cost to society.)
• Bioenergy is the next most important technology. The “limited bioenergy” scenario increases bioenergy use to 5.5 times 2008 levels by 2050, and it will be very costly if we restrict bioenergy to that level. There are a number of concerns about how sustainable this path will be, and with larger increases in temperatures, the quantity of biomass available for electricity and fuels.
• If we don’t get our act together a few years ago, we will be using bioenergy and carbon capture and storage together. Bioenergy will take carbon dioxide out of the atmosphere and CCS will put it into permanent storage. This will cost several hundred dollars/ton CO2, and is relatively cheap compared to the alternative (climate change), although much more expensive than getting our act together.
• To the extent that we add nuclear, wind, and solar as rapidly as makes sense, we reduce dependence on bioenergy.
• Given the relative importance of carbon capture and storage, it may make sense for nations (e.g., Germany) and states (e.g., California) that want to jump start technologies to focus more on CCS than on renewables.
• Do all solutions, now.

Which solutions for electricity are important?
IPCC provides an answer by calculating the cost of failing to use the solution.

Efficiency
Efficiency remains the single largest technology solution, along with shifting to best available technologies: more efficient power plants, cars, buildings, air conditioners, and light bulbs. Since so many buildings are being constructed, and power plants built, with a lifetime of decades, early implementation of efficiency makes the task possible. The cost of failing to add efficiency sufficiently rapidly isn’t calculated in the Summary for Policymakers, but assume it’s more than we want to pay.

Nuclear and Solar + Wind
Can we do without renewables or nuclear power? Looking at only the attempt to reduce greenhouse gas emissions from electricity, IPCC found that opting out of nuclear power would increase costs by 7% in the 450 parts per million CO2-equivalent goal, and limiting wind and solar would increase costs by 6%. To stay below 550 ppm CO2-eq, costs would go up 13% (of a much smaller cost) without nuclear, and 8% without solar and wind. Crossing either off the list looks pretty unattractive.

Go to Working Group 3 for the full report, and the technical summary. IPCC also has an older report, Special Report on Renewable Energy Sources and Climate Change Mitigation.

Caveats re nuclear:

Nuclear energy is a mature low-GHG emission source of baseload power, but its share of global electricity generation has been declining (since 1993). Nuclear energy could make an increasing contribution to low-carbon energy supply, but a variety of barriers and risks exist (robust evidence, high agreement). Those include: operational risks, and the associated concerns, uranium mining risks, financial and regulatory risks, unresolved waste management issues, nuclear weapon proliferation concerns, and adverse public opinion (robust evidence, high agreement). New fuel cycles and reactor technologies addressing some of these issues are being investigated and progress in research and development has been made concerning safety and waste disposal.

I’m not sure what risks are associated with uranium mining.

Caveats re renewable energy (RE), excluding bioenergy:

Regarding electricity generation alone, RE accounted for just over half of the new electricity generating capacity added globally in 2012, led by growth in wind, hydro and solar power. However, many RE technologies still need direct and/or indirect support, if their market shares are to be significantly increased; RE technology policies have been successful in driving recent growth of RE. Challenges for integrating RE into energy systems and the associated costs vary by RE technology, regional circumstances, and the characteristics of the existing background energy system (medium evidence, medium agreement).

Note: the capacity factor for intermittents like wind and solar (and sometimes hydro), the percentage of electricity actually produced compared to what would be produced if the source ran at maximum capacity 24/7, is dramatically less than for nuclear and other sources of electricity. Added capacity (gigawatts brought online) does not communicate how much electricity, GWh, was added. The increase in coal in 2012 was 2.9% (see coal facts 2013). Since coal was 45% of 2011 electricity, the increase in coal was far greater than the increase in wind and solar combined.

Bioenergy
The use of bioenergy increases dramatically in all scenarios. If we limit bioenenergy to 5.5 x 2008 levels, costs rise 64% (18% of a smaller number for 550 ppm scenario). Bioenergy, using plants for fuels and power (electricity) dominates high renewables scenarios.

Caveats re bioenergy:

Bioenergy can play a critical role for mitigation, but there are issues to consider, such as the sustainability of practices and the efficiency of bioenergy systems (robust evidence, medium agreement). Barriers to large scale deployment of bioenergy include concerns about GHG emissions from land, food security, water resources, biodiversity conservation and livelihoods. The scientific debate about the overall climate impact related to landuse competition effects of specific bioenergy pathways remains unresolved (robust evidence, high agreement). Bioenergy technologies are diverse and span a wide range of options and technology pathways.

There are many concerns about the amount of bioenergy—biopower and biofuels. With so many demands on land facing an increasing population wishing to supply food, fiber, green chemicals, etc in a world with a rapidly changing climate, sustainability is not foreordained. The Special Report on Renewable Energy Sources and Climate Change Mitigation estimates the net effect on yields to be small worldwide at 2°C, although regional changes are possible. By mid-century, temperature increase over pre-industrial could be more than 2°C, and yields are more uncertain.

Note: fusion energy is not mentioned in this short summary, but such strong dependence on bioenergy gives an idea why there is so much research on somewhat speculative sources of energy.

Carbon Capture and Storage
Carbon capture and storage (CCS) provides even more of the solution—costs go up 138% if we do without carbon capture and storage for the 450 ppm scenario (39% of a smaller number for 550 ppm scenario). Part of the attraction of CCS is that it can help deal with all the electricity currently made using fossil fuels. A number of countries are heavily invested in fossil fuel electricity, and a smaller number of countries, from China to Germany, are adding coal plants at a rapid rate, and will likely be reluctant to let expensive capital investments go unused. Additionally, as International Energy Agency (IEA) points out, almost half of carbon capture and storage is aimed at decarbonizing industry: steel, aluminum, oil refineries, cement, and paper mills use fossil fuel energy directly. Nuclear is often not practical in such situations, and wind and solar rarely are.

BECSS—Bioenergy and CCS
One of the cheaper ways to take carbon out of the atmosphere is to combine bioenergy and carbon capture and storage. Using plant matter to make electricity is nearly carbon neutral, as plants take carbon dioxide out of the atmosphere to grow, and release it back when they are burned for electricity or fuel. However, CCS can store that CO2 permanently. Cheaper is relative to the costs of climate change, as the cost is expected to be several hundred dollars/ton. This method is much more expensive than other methods of addressing climate change that are currently underutilized.

The International Energy Association booklet, Combining Bioenergy with CCS, discusses the challenges of ascertaining whether the biomass was grown sustainably.

Note: IEA gives some sense of how rapidly CCS should come online:

Goal 1: By 2020, the capture of CO2 is successfully demonstrated in at least 30 projects across many sectors, including coal- and gas-fired power generation, gas processing, bioethanol, hydrogen production for chemicals and refining, and DRI. This implies that all of the projects that are currently at an advanced stage of planning are realised and several additional projects are rapidly advanced, leading to over 50 MtCO2 safely and effectively stored per year.

Goal 2: By 2030, CCS is routinely used to reduce emissions in power generation and industry, having been successfully demonstrated in industrial applications including cement manufacture, iron and steel blast furnaces, pulp and paper production, second-generation biofuels and heaters and crackers at refining and chemical sites. This level of activity will lead to the storage of over 2 000 MtCO2/yr.

Goal 3: By 2050, CCS is routinely used to reduce emissions from all applicable processes in power generation and industrial applications at sites around the world, with over 7 000 MtCO2 annually stored in the process.

How much more low-GHG electricity is needed?
IPCC says 3 – 4 times today’s level by 2050. About 33% of today’s electricity is low-GHG, so by mid-century, more electricity than we make today will need to come from fossil fuel and bioenergy with CCS, nuclear, hydro, wind, solar, and other renewables.

For some of the challenges to rapidly increasing reliance on any energy source, see David McKay’s Sustainable Energy—Without the Hot Air.

Uncertainty and climate change adaptation—Part 1, Transportation

February 19th, 2014

Uncertainty is sometimes our friend, but not for climate change.

We don’t know:

? How much greenhouse gas will we choose to emit?
? How much will a particular quantity of GHG warm the Earth?
? How will that increase in Earth’s temperature change the weather (average temperatures, and ranges? average precipitation, and ranges?)
? How do we prepare for a future we’re not sure of when we find it so challenging to prepare for current realities?

Future posts will look at other challenges to adaptation—water availability, storm surges, agriculture, and ecosystems. This post will focus on transportation.

• Where do we locate new roads, and when do begin to move the current ones? San Francisco sees a threat to the Great Highway, with NASA predicting a sea level increase of 16″ (40 cm) by mid-century, and 55″ (140 cm) by the end of the century. In Alaska, roads are buckling as the permafrost melts, and in some areas, road access has been reduced to 100 days, down from 200.

• How will travel preferences change as costs are added to greenhouse gas emissions, making travel by bus and train more attractive, relative to travel by car. In many places, transportation infrastructure is being built for business-as-usual scenarios that assume no behavior switching. Even reallocating lanes in existing infrastructure, perhaps to give buses more priority, can engender controversy.

• What temperatures should roads be designed for? Freeways buckled in Germany when temperatures reached 93°F (34°C), resulting in accidents and one death.

Buckling highways

Buckling Highways: German Autobahns Can’t Stand the Heat

• How will trains cope with climate change? Floods are a problem (Amtrak didn’t provide service between Denver and Chicago for weeks in 2008 due to floods). Heat is as well. Amtrak had a heat solution: require speeds to stay below 80 mph (130 kph) when temperatures exceeded 95°F (35°C). Unfortunately, as described in Changes in Amtrak’s Heat Order Policy,

The impact on schedule performance and track capacity was substantial, considering that the Northeast Corridor (NEC) handles up to 2,400 trains per day at speeds up to 150 MPH. The disruption was attributed to increased running times, trains arriving at key capacity choke points out of sequence, and inability to turn trains consists in a timely manner at terminals.

For now, Amtrak is working to establish a better protocol for heat triggers, but at some point, there will be a number of days each year in a number of locations where today’s train infrastructure won’t work with the new temperatures.

heatwave in Australia

Heatwave in Australia

The National Academy of Sciences discusses five climate changes expected to have important effects on transportation in Potential Impacts of Climate Change on U.S. Transportation:

• Increases in very hot days and heat waves,
• Increases in Arctic temperatures,
• Rising sea levels,
• Increases in intense precipitation events, and
• Increases in hurricane intensity

Naturally, NAS has some recommendations. Does transportation decision-making in your region incorporate their ideas, or other similar ideas, into planning?

Finding: The past several decades of historical regional climate patterns commonly used by transportation planners to guide their operations and investments may no longer be a reliable guide for future plans. In particular, future climate will include new classes (in terms of magnitude and frequency) of weather and climate extremes, such as record rainfall and record heat waves, not experienced in modern times as human-induced changes are superimposed on the climate’s natural variability.

Finding: Climate change will affect transportation primarily through increases in several types of weather and climate extremes, such as very hot days; intense precipitation events; intense hurricanes; drought; and rising sea levels, coupled with storm surges and land subsidence. The impacts will vary by mode of transportation and region of the country, but they will be widespread and costly in both human and economic terms and will require significant changes in the planning, design, construction, operation, and maintenance of transportation systems.

Recommendation 1: Federal, state, and local governments, in collaboration with owners and operators of infrastructure, such as ports and airports and private railroad and pipeline companies, should inventory critical transportation infrastructure in light of climate change projections to determine whether, when, and where projected climate changes in their regions might be consequential.

Finding: Potentially, the greatest impact of climate change for North America’s transportation systems will be flooding of coastal roads, railways, transit systems, and runways because of global rising sea levels, coupled with storm surges and exacerbated in some locations by land subsidence.

Recommendation 2: State and local governments and private infrastructure providers should incorporate climate change into their long-term capital improvement plans, facility designs, maintenance practices, operations, and emergency response plans.

Finding: The significant costs of redesigning and retrofitting transportation infrastructure to adapt to potential impacts of climate change suggest the need for more strategic, risk-based approaches to investment decisions.

Recommendation 3: Transportation planners and engineers should use more probabilistic investment analyses and design approaches that incorporate techniques for trading off the costs of making the infrastructure more robust against the economic costs of failure. At a more general level, these techniques could also be used to communicate these trade-offs to policy makers who make investment decisions and authorize funding.

Finding: Transportation professionals often lack sufficiently detailed information about expected climate changes and their timing to take appropriate action.

Recommendation 4: The National Oceanic and Atmospheric Administration, the U.S. Department of Transportation (USDOT), the U.S. Geological Survey, and other relevant agencies should work together to institute a process for better communication among transportation professionals, climate scientists, and other relevant scientific disciplines, and establish a clearinghouse for transportation-relevant climate change information.

Finding: Better decision support tools are also needed to assist transportation decision makers.

Recommendation 5: Ongoing and planned research at federal and state agencies and universities that provide climate data and decision support tools should include the needs of transportation decision makers.

Finding: Projected increases in extreme weather and climate underscore the importance of emergency response plans in vulnerable locations and require that transportation providers work more closely with weather forecasters and emergency planners and assume a greater role in evacuation planning and emergency response.

Recommendation 6: Transportation agencies and service providers should build on the experience in those locations where transportation is well integrated into emergency response and evacuation plans.

Finding: Greater use of technology would enable infrastructure providers to monitor climate changes and receive advance warning of potential failures due to water levels and currents, wave action, winds, and temperatures exceeding what the infrastructure was designed to withstand.

Recommendation 7: Federal and academic research programs should encourage the development and implementation of monitoring technologies that could provide advance warning of pending failures due to the effects of weather and climate extremes on major transportation facilities.

Finding: The geographic extent of the United States—from Alaska to Florida and from Maine to Hawaii—and its diversity of weather and climate conditions can provide a laboratory for identifying best practices and sharing information as the climate changes.

Recommendation 8: The American Association of State Highway and Transportation Officials (AASHTO), the Federal Highway Administration, the Association of American Railroads, the American Public Transportation Association, the American Association of Port Authorities, the Airport Operators Council, associations for oil and gas pipelines, and other relevant transportation professional and research organizations should develop a mechanism to encourage sharing of best practices for addressing the potential impacts of climate change.

Finding: Reevaluating, developing, and regularly updating design standards for transportation infrastructure to address the impacts of climate change will require a broad-based research and testing program and a substantial implementation effort.

Recommendation 9: USDOT should take a leadership role, along with those professional organizations in the forefront of civil engineering practice across all modes, to initiate immediately a federally funded, multiagency research program for ongoing reevaluation of existing and development of new design standards as progress is made in understanding future climate conditions and the options available for addressing them. A research plan and cost proposal should be developed for submission to Congress for authorization and funding of this program.

Recommendation 10: In the short term, state and federally funded transportation infrastructure rehabilitation projects in highly vulnerable locations should be rebuilt to higher standards, and greater attention should be paid to the provision of redundant power and communications systems to ensure rapid restoration of transportation services in the event of failure.

Finding: Federal agencies have not focused generally on adaptation in addressing climate change.

Recommendation 11: USDOT should take the lead in developing an interagency working group focused on adaptation.

Finding: Transportation planners are not currently required to consider climate change impacts and their effects on infrastructure investments, particularly in vulnerable locations.

Recommendation 12: Federal planning regulations should require that climate change be included as a factor in the development of public-sector long-range transportation plans; eliminate any perception that such plans should be limited to 20 to 30 years; and require collaboration in plan development with agencies responsible for land use, environmental protection, and natural resource management to foster more integrated transportation–land use decision making.

Finding: Locally controlled land use planning, which is typical throughout the country, has too limited a perspective to account for the broadly shared risks of climate change.

Finding: The National Flood Insurance Program and the FIRMs used to determine program eligibility do not take climate change into account.

Recommendation 13: FEMA should reevaluate the risk reduction effectiveness of the National Flood Insurance Program and the FIRMs, particularly in view of projected increases in intense precipitation and storms. At a minimum, updated flood zone maps that account for sea level rise (incorporating land subsidence) should be a priority in coastal areas.

Finding: Current institutional arrangements for transportation planning and operations were not organized to address climate change and may not be adequate for the purpose.

Recommendation 14: Incentives incorporated in federal and state legislation should be considered as a means of addressing and mitigating the impacts of climate change through regional and multistate efforts.

Part 2: Changes in water availability

Fukushima update—The current state of F-D cleanup, part 5

November 19th, 2013

The previous two posts in this series looked at a number of concerns from the anti-nuclear community, and some newspapers that should know better, and found no evidence for their concerns. However, concerns about how Japan and Tepco are doing have been expressed by more credible sources. This is an update on those concerns, mostly about water. What I learned while researching this is that they are not about safety, but about reassuring the public, and doing the project right—whether or not safety is an issue.

The first rather lengthy section comes from an article by an adviser to the Japanese with experience in the U.S. cleanup after Three Mile Island. This is followed by some short sections linking to high level criticisms over Japanese handling of the Fukushima accident—some recent, some older.

Lake Barrett, Tepco Adviser, writes about the problems in Japan

Lake Barrett has been brought in by Tokyo Electric Power (Tepco) as an advisor on cleanup of the Fukushima Dai-ichi accident. He headed the Three Mile Island Cleanup Site Office for Nuclear Regulatory Commission (NRC) from 1980 to 1984, in the years immediately after the 1979 accident.

In an article in Bulletin of the Atomic Scientists, Barrett summarizes the current state of the accident. Bottom line—the Japanese have done heroic work so far. They have to deal with a number of water issues. The problems are much more about public confidence than safety, and Japan coming to terms with how much of its admittedly significant resources to spend on relatively minor issues. Here are a few more details:

• Even accidents that have low health impacts such as the Fukushima accident can be socially disruptive and have huge cleanup costs.

• In the U.S. (and presumably elsewhere), multibillion dollar improvements were implemented after both Three Mile Island and F-D.

• Contaminated water is part of the mess of cleanup, more at F-D than at TMI. While the contamination is

at a very low level and presents little risk to the public or the environment… [still it can be] significant from a public-confidence perspective. So it is vitally important that Japan have a comprehensive accident cleanup plan in place that is not only technically protective of human health and the environment, but is also understood to be protective by the public…

[Tepco] has worked hard and has indeed contained most of the significant contamination carried by water used to cool the plant’s damaged reactor cores. Still, a series of events—including significant leakage from tanks built to hold radioactive water—has eroded public confidence….[The plan used] needs to include a new level of transparency for and outreach to the Japanese public, so citizens can understand and have confidence in the ultimate solution to the Fukushima water problem, which will almost certainly require the release of water—treated so it conforms to Japanese and international radioactivity standards—into the sea…

While most of the highly contaminated water has been dealt with, Tepco and the Japanese government are “having great difficulty in managing the overall contaminated-water situation, especially from a public-confidence perspective. The engineering challenge—control of a complex, ad hoc system of more than 1,000 temporary radioactive water tanks and tens of miles of pipes and hoses throughout the severely damaged plant—is truly a herculean task. Explaining what is going on and what has to be done to an emotional, traumatized, and mistrusting public is an even larger challenge.

The politics of the solutions are more challenging than the technical solutions.

• The technical aspects of the problems are mostly about water:
—340,000 tons (cubic meters)/90 million gallons of radioactive water stored in more than 1,000 tanks. Most of the radioactivity, the cesium-134 and cesium-137, as well as oils and salts, have been removed, and this water is being recycled back into the cores to continue cooling them. The current method of cleaning the water does not remove strontium.
—Ground water is leaking into the reactor cores (this is where most of the 340,000 tons of stored water comes from).

This building-basement water is the highest-risk water associated with the Fukushima situation. That water is being handled reasonably well at present, but because of the constant in-leakage of groundwater, some ultimate disposition will eventually be necessary. [A system of cleaning the water is now being tested.] In fact, I am writing this article while sitting on an airplane, and I am receiving more ionizing radiation from cosmic rays at this higher altitude than I would receive from drinking effluent water from the Advanced Liquid Waste Processing System.

—Also of concern,

water flowed into underground tunnels that connect buildings at the plant, and into seawater intake structures. These many tunnels contain hundreds, if not thousands, of pipes and cables. Most of these were non-safety grade tunnels that were cracked by the earthquake. In March and April 2011, therefore, fairly large volumes of highly contaminated water likely flowed into the ground near the sea and, at some points, directly into the sea….Although the amount of radioactivity in this groundwater is only a very small fraction of what was released in March and April 2011, this contamination has become an emotional issue, because the public believes it had been told the leakage was stopped. It is in fact true that the gross leakage of highly contaminated water from Fukushima buildings and pipes has been stopped. Still, approximately 400 tons (105,000 gallons) of groundwater per day is moving toward the sea from these areas, and it contains some contamination from these earlier leakage events. The amount of radioactivity in this water flow does not represent a high risk; the concentrations are generally fairly low…Regardless of the relatively low concentration of radioactive contaminants and Tepco’s efforts at containment, the water entering the sea in an uncontrolled manner is very upsetting to many people.

—Cesium which settled on the soil in the early days of the accident will be washed into the ocean; Tepco can’t prevent this large volume, low radioactivity transfer to the ocean. This is 600 tons (155,00 gallons) per day.

• Tepco can do better, with some suggestions. But bottom line:

Enormous amounts of scarce human and financial resources are being spent on the current ad hoc water-management program at Fukushima, to the possible detriment of other high-importance clean up projects. Although Japan is a rich country, it does not have infinite resources. Substantial managerial, technical, and financial resources are needed for the safe removal of spent nuclear fuel from the units 1, 2, 3, and 4 spent fuel pools, and to develop plans and new technologies for eventually digging out the melted cores from the three heavily damaged reactor buildings. Spending billions and billions of yen on building tanks to try to capture almost every drop of water on the site is unsustainable, wasteful, and counterproductive. Such a program cannot continue indefinitely…I see no realistic alternative to a program that cleans up water with improved processing systems so it meets very protective Japanese release standards and then, after public discussion, conducts an independently confirmed, controlled release to the sea.

Videos of current Tepco plans

Cleanup plans

Plans for spent fuel pool 4

A number of Japanese reports were highly self-critical

Reports issued by different levels of the Japanese government and various regulatory bodies and academics saw the Japanese culture of safety as inadequate; this, as well as a once in a millennium tsunami, led to the accident. A number of reports emphasized that the Japanese had failed to learn from major accidents such as Three Mile Island in the U.S. and the flooding of the French Blayais nuclear plant in 1999. Nor had they seen it as necessary to make improvements incorporated over time in other countries.

Atsuyuki Suzuki, former president of the Japanese Atomic Energy Agency, and now senior scientific adviser to his successor, listed some of these reports in a talk at UC, Berkeley (start around 8 minutes for a longer list):
• country specific-groupthink with consensus first, overconfidence, etc (Parliament)
• human caused disaster, lack of emergency preparedness (government)
• lack of safety consciousness, ignoring both natural events and worker training (academic)

Suzuki emphasized the reluctance to learn from accidents and insights in other countries, as well as “undue concerns about jeopardizing local community’s confidence if risks are announced” and the “regulator’s difficult position due to the public perception that the government must be prevailingly correct at every moment.” He also talked about the time it takes to move to a safety culture.

We are now seeing outreach to non-Japanese experts. Japanese Deputy Foreign Minister Shinsuke Sugiyama and U.S. Deputy Secretary of Energy Daniel Poneman met November 4, 2013 in the second of a series of meetings to establish bilateral nuclear cooperation. In addition to Lake Barrett, Dale Klein (former head of the U.S. NRC), Barbara Judge, former head of the UK Atomic Energy Authority, and others have been invited as advisers. Time will tell if this cooperation continues, and if Japan incorporates improvements in parallel with those required in other countries.

Outside criticisms of Japanese and Tepco management of the cleanup, and of communication

There is general agreement that the Japanese government was trained at the anti-Tylenol school of disaster communication.

World Nuclear Association posted August 28, 2013, about Japan’s Nuclear Regulation Authority’s failure to listen to International Atomic Energy Agency—NRA went back and forth on how to rate an incident, rating an incident 3 which should have been a 1 or 0 (incidents are rated from 1 to 3 on the International Nuclear Events Scale, or INES; accidents from 4 to 7):

“In Japan we have seen a nuclear incident turn into a communication disaster,” said Agneta Rising, Director General of the World Nuclear Association. “Mistakes in applying and interpreting the INES scale have given it an exaggerated central role in coverage of nuclear safety.” WNA noted that the leakage from a storage tank “was cleared up in a matter of days without evidence of any pollution reaching the sea.” “However, news of the event has been badly confused due to poor application and interpretation of the International Nuclear Event Scale (INES), which has led to enormous international concern as well as real economic impact.” The regulator’s misuse of the International Nuclear Event Scale ratings “cannot continue: if it is to have any role in public communication, INES must only be used in conjunction with plain-language explanations of the public implications – if any – of an incident,” said Rising.

WNA urged Japan’s Nuclear Regulatory Authority to listen to the advice it has received from the International Atomic Energy Agency: “Frequent changes of rating will not help communicate the actual situation in a clear manner,” said the IAEA in a document released by the NRA. The IAEA questioned why the leak of radioactive water was rated as Level 3 on the INES scale: “The Japanese Authorities may wish to prepare an explanation for the media and the public on why they want to rate this event, while previous similar events have not been rated.” Since then the NRA has admitted that the leak could have been much smaller than it said, and also it transpires that the water in the tank was 400 times less radioactive than reported (0.2 MBq/L, not 80 MBq). The maximum credible leakage was thus minor, and the Japan Times 29/8 reports the NRA Chairman saying “the NRA may reconsider its INES ranking should further studies show different amounts of water loss than those provided by Tepco.” The last three words are disingenuous, in that Tepco had said that up to 300 m3 might have leaked, it was NRA which allowed this to become a ‘fact’. Maybe back to INES level 1 or less for the incident.

Since the leak was discovered, each announcement has been a new media event that implied a worsening situation. “This is a sad repeat of communication mistakes made during the Fukushima accident, when INES ratings were revised several times,” said Rising. “This hurt the credibility of INES, the Japanese government and the entire nuclear sector – all while demoralising the Japanese people needlessly.” “INES will continue to be used ….. but it represents only one technical dimension of communication and that has now been debased.”

There were concerns about whether, and how effectively, Japan was requesting help, in this case on the permafrost project:

The Japanese firms involved appear to be taking a go-it-alone approach. Two weeks ago, a top official at Tokyo Electric Power (Tepco) signaled that the utility behind the Fukushima disaster would seek international assistance with the Fukushima water contamination crisis. But experts at U.S.-based firms and national labs behind the world’s largest freeze-wall systems—and the only one proven in containing nuclear contamination—have not been contacted by either Tepco or its contractor, Japanese engineering and construction firm Kajima Corp.

There was high level concern about both planning and communication:

Tepco needs “to stop going from crisis to crisis and have a systematic approach to water management,” Dale Klein, the chairman of an advisory panel to Tepco and a former head of the U.S. Nuclear Regulatory Commission, said.

Appearing to believe that no one in Japan was explaining radioactivity to the Japanese, some outside experts discussed health issues with the Japanese public.

And all along there have been concerns about how the Japanese treat workers at the Fukushima and other nuclear plants. Worker pay at the Fukushima plant recently doubled to $200/day, and better meals will be provided. It appears to remain true that a majority of workers at Japanese power plants are picked up on street corners.

Getting to Safety

The story of how workers are treated has little to do with safety issues, apparently, although it’s harder to have most of your staff trained in safety procedures if they are irregular workers. It helps maintains an image of Tepco as a company that doesn’t care about employees. Contrast this with Alcoa’s experience under Paul O’Neill. As discussed by Charles Duhigg in The Power of Habit, O’Neill focused on safety. Managers went into self-protective mode and began asking workers how to make the workplace safer, and while they were talking, workers shared other ideas. Alcoa became highly profitable because of the focus on safety.

It takes a while to shift to a culture that emphasizes safety. The U.S. process has been aided by the Nuclear Regulatory Commission, which ordered very costly upgrades after Three Mile Island. The safer plants operated with fewer unplanned outages, and capacity factor, the percentage of time the plant is running, went from less than 60% in 1979 to 90% today. Since a very expensive capital investment which is not operating is an unprofitable investment, the effect of NRC’s regulations was to make the industry profitable. Additionally, the U.S. has another tool for improvement, Institute of Nuclear Power Operations. INPO describes their purpose:

INPO employees work to help the nuclear power industry achieve the highest levels of safety and reliability – excellence – through:

• Plant evaluations
• Training and accreditation
• Events analysis and information exchange
• Assistance

In the Q&A at the end of the Suzuki talk, one person asserted that INPO’s actions have been even more important than NRC’s, and I saw head-nodding. Suzuki’s response was that Japan is not ready for the current U.S. NRC/INPO path. [The idea is that just as people need to learn a variety of motions—sideways and falling—before learning complicated games like basketball, Japan has to spend time learning simpler skills, or unlearning skills that makes consensus work better in the country with such high population density.]

Summary

It takes years to shift to a culture of safety, and just become some industries adopt doesn’t mean others aren’t left behind. In the U.S., any number of industries are far from giving us a sense that they are safe—natural gas, oil refineries, and chemical industries all have worse records than nuclear power. But nuclear is held to different standards, and there will be world pressure on all nations with nuclear power to take international advice. They may not. We can hope that they do. And that a culture of safety spreads to other more dangerous industries.

Both getting to a culture of safety, and staying there, are helped by sensible decisions imposed by a regulatory body AND improvements in the workplace culture. This means more communication, more respect for workers, and workers who have a commitment to the company (not day labor). Nuclear utilities, in every country, would benefit from communication about best practices elsewhere, at both a regulatory level and a workplace level a la INPO in the U.S. It appears that pressure from the Japanese public and nuclear professionals outside Japan is moving the Japanese in this direction. There are studies focused on workplace cultures, with less superficial recommendations; hopefully utilities around the world are paying attention to these as well.

The Japanese social structure appears to encourage poor communication about risks beforehand, and gratuitous and expensive “protective actions” later, such as cleanup to a level far beyond what international organizations see as necessary. The effect is increasing public anxiety, and shifting money from important projects.

Over time, and with ongoing shifts in Japanese society (or at least the nuclear portion), the dangers of new accidents, and concerns about this one, will decrease. Money will be spent in ways that contribute more to society. And Japan can return to fighting climate change.

Part 1 Bottom line numbers
Part 2 The state of the evacuation, food and fish
Part 3 The plume and fish come to North America
Part 4 The history of predictions on spent fuel rods

Climate departure

October 20th, 2013

A new analysis by Camilo Mora, et al from University of Hawaii, projects the dates of climate departure,

when the projected mean climate of a given location moves to a state continuously outside the bounds of historical variability

compared to 1860 to 2005. This is the date when the coldest year is warmer than the warmest year in our past.

year of climate departure
Year of climate departure on our current emissions path

Worldwide the average year for climate departure is 2047. The effects on the tropics are more serious, not because temperature increases will be larger, but because normal variability is small. The mean year for the tropics under this scenario is 2038, later (2053) for cities outside the tropics.

One consequence is that poor areas appear to be suffering first, with one city in Indonesia likely to see climate departure within the decade (2020). Lagos (2029) and Mexico City (2031) are projected to reach this point within 2 decades; both have populations over 20 million. A number of large cities in the United States are expected to see temperatures rise to historically unknown levels by the late 40s and 50s. This is for the high greenhouse gas emissions scenario RCP8.5* (not the highest).

The Mora Lab site has projected dates for many more cities; check them out if your city isn’t listed.

The low greenhouse gas emissions scenario (RCP4.5*) delays average climate departure to 2069 but does not prevent it. The first affected area of Indonesia will see the date move up to 2025. Lagos won’t see climate departure until 2043, and Mexico City until 2050. A number of large cities in the US see their own dates delayed until the 2070s or even later.

The Mora paper discusses the effects on the ocean, which will see climate departure in the next decade or so. When considering temperature and acidity together, the ocean moved outside its normal variability in 2008.

For more information
Cities around the world
Model predictions
• Wondering when your favorite species will see a world outside normal variability?

Table Species group year of climate departure

SPECIES GROUP RCP8.5 RCP4.5
Marine Birds 2054 2084
Terrestrial Reptiles 2041 2087
Amphibians 2039 2080
Marine Mammals 2042 2077
Terrestrial Birds 2038 2082
Terrestrial Mammals 2038 2079
Plants 2036 2077
Marine Fish 2039 2073
Cephalopods 2038 2074
Marine Reptiles 2038 2074
Seagrasses 2038 2073
Mangroves 2035 2070
Coral Reefs 2034 2070

* Some more information on RCP4.5 and RCP8.5

Intergovernmental Panel on Climate Change has new scenarios, called Representative Concentration Pathways. The number, 4.5 or 8.5, represents the warming in 2100 in watts/sq meter, or W/m2. If the number is positive, that means there is still a net warming of Earth. The most optimistic scenario provided by IPCC in the latest report is RCP2.5, where the net flow of energy in is at the rate of 2.5 watts/sq meter, down from a peak a few decades from now at 3 W/m2. This scenario, considered perhaps too optimistic, is likely to keep temperature increase below 2°C. A more reasonable low estimate is RCP4.5, which will produce a temperature increase by the last two decade of the 21st century of close to 3°C over preindustrial times, and RCP8.5, our current trajectory, which could produce a temperature increase closer to 5°C.

RCP4.5 allows us to emit about 780 billion tons of carbon (carbon dioxide) between 2012 and 2100. RCP allows 1685 billion tons of carbon in the same period. (Multiply quantity of carbon by 44/12 to get quantity of carbon dioxide.) Carbon emissions in 2012 were 9.7 billion tons. Counting land use change, the number is even higher. The average rate of increase was 3.2%/year from 2000 to 2009 (doubling time = 22 years).

On the nature of science

October 18th, 2013

I posted a portion of the notebook used in the Friends General Conference 2013 workshop, Friends Process: Responding to Climate Change (Gretchen Reinhardt and I co-led it).

Go to On the Nature of Science to read more, leave comments here.

Topics:
• What is Science?
• Scientific Consensus
• How Scientists Communicate Results
• “But Scientists Are Always Changing Their Minds!”

Fukushima update—The history of predictions on spent fuel rods, part 4

October 3rd, 2013

Part 3 addresses dire but unsubstantiated warnings that North America is in danger from a radioactive plume and fish. This will focus on another set of warnings, that the spent fuel pool at Fukushima Dai-ichi could turn out to be a major problem for human health, perhaps much worse than Chernobyl. Some of the material below comes from a Truthout article citing a number of anti-nuclear experts, and its links. How likely are their predictions? Did these people make reliable predictions in the past?

Introduction: basic facts to get us started

• Nuclear power plants don’t blow up like bombs.
• Spent fuel pools store fuel which is completely spent, or relatively fresh fuel during maintenance. Water keeps the fuel rods cool, and protects us from radiation which can’t make it through 20 feet (7 meters) of water. Reactor 4’s spent fuel pool was unusually full. (See more here)
• The spent fuel pool for reactor 4 never blew up, and never dried up. There is no evidence that it is shaky.
• By April 2011, much was known:

Radionuclide analysis of water from the used fuel pool of Fukushima Dai-ichi unit 4 suggests that some of the 1331 used fuel assemblies stored there may have been damaged, but the majority are intact.

• There is a danger that spent fuel can catch fire. According to NUREG /CR-4982,

In order for a cladding fire to occur the fuel must be recently discharged (about 10 to 180 days for a BWR and 30 to 250 days for a PWR).

The Fukushima Dai-ichi reactors were BWRs, boiling water reactors. (More on NUREG series here.)

Incorrect predictions about the spent fuel pool began early

Paul Blustein writes about Nuclear Regulatory Commission (NRC) chair Gregory Jaczko’s recommendation that Americans evacuate if they were within 50 miles of the accident:

It was an honest mistake. On the morning of March 16, 2011, top officials of the U.S. Nuclear Regulatory Commission concluded that the spent fuel pool in Reactor No. 4 at Fukushima Dai-ichi must be dry.

Thus began an episode that had enormous implications for the trust that Japanese people have in their public officials. To this day, millions of Japanese shun food grown in the northeast region of their country; many who live in that area limit their children’s outdoor play, while others have fled to parts of Japan as far from Fukushima as possible. The reason many of them give is that they simply can’t believe what government authorities say about the dangers of radiation exposure.

The evidence that led a high official in the U.S. government to publicly attack the credibility of another government came from drone flyover sensing heat, but did not depend on multiple lines of evidence (was radioactivity especially high nearby? What fission products were seen downwind from the plant?)

By that evening, Jaczko’s subordinates were already starting to hedge their assessments about the pool when the chairman joined another conference call. The U.S. staffers in Tokyo had heard from Japanese investigators that even though the exterior wall protecting the pool appeared to be demolished, an interior wall was evidently intact; the Japanese offered other evidence as well.

Chuck Casto, the Tokyo-based team leader, related those points to Jaczko, saying he still wasn’t convinced even after seeing a video of what the Japanese claimed was water in the pool. To Casto it was “really inconclusive.” But he acknowledged that the video, taken from a helicopter 14 hours earlier, showed steam emissions.

Jaczko knew his error within 24 hours of publicly stating it, although the U.S. NRC waited 3 months to share this information. (Jaczko resigned in mid-2012 because of widespread unhappiness with his management style.)

And then in 2012

A year later, we hear again vague warnings about the dangers of the fuel pools, this time in the NY Times:

Fourteen months after the accident, a pool brimming with used fuel rods and filled with vast quantities of radioactive cesium still sits on the top floor of a heavily damaged reactor building, covered only with plastic.

The public’s fears about the pool have grown in recent months as some scientists have warned that it has the most potential for setting off a new catastrophe, now that the three nuclear reactors that suffered meltdowns are in a more stable state, and as frequent quakes continue to rattle the region….

[Or if we don’t like that idea], Some outside experts have also worked to allay fears, saying that the fuel in the pool is now so old that it cannot generate enough heat to start the kind of accident that would allow radioactive material to escape.

The author cites “scientists” but never names them, gives no evidence they meet traditional assumptions we hold for the word scientist, nor provides a mechanism by which there might be problems now that the fuel rods have cooled down. It is a “he said, she said article”, and we are left to guess. For this article, at least, “outside experts” appear to know more than “some scientists”.

Robert Alvarez also warned us in 2012:

Spent reactor fuel, containing roughly 85 times more long-lived radioactivity than released at Chernobyl, still sits in pools vulnerable to earthquakes.” He warns of possible collapse from a combination of structural damage and another earthquake. “The loss of water exposing the spent fuel will result in overheating and can cause melting and ignite its zirconium metal cladding resulting in a fire that could deposit large amounts of radioactive materials over hundreds, if not thousands of miles.

Yet Tepco has continued to monitor the structural reliability of the spent pool fuels. A huge fire would be required before the radioactivity could be dispersed long distances, and per the introduction, it won’t occur just because it is exposed to the air. Is there some mechanism, up to and including nuclear bombs, that could actually disperse 85 x the radioactivity of Chernobyl? 1% of that amount? Neither Alvarez nor any writer appears to provide one.

Alvarez has experience working in nuclear weapons issues, in and out of government, but no science degree and he does not publish for scientists—I only checked his claims to have published in the journal Science and in Technology Review. Over time, I’ve learned to confirm assertions that people have published in respected journals (the latter is not peer reviewed). My search in Technology Review found nothing. It was not an article in Science (30 April 1982), which would have undergone peer review, but a letter to the editor. In it, Alvarez defends scientists who claim that low level radioactivity is 10-25 times worse than had been thought, a claim which long has few if any adherents.

Dan Yurman addresses Alvarez’s claims in a little more detail and links to a Tepco video of fuel pool 4.

Arnie Gundersen adds even more worries

It’s 2013, and Gundersen is adding erroneous details about what can go wrong:

Well, they’re planning as of November to begin to do it, so they’ve made some progress on that. I think they’re belittling the complexity of the task. If you think of a nuclear fuel rack as a pack of cigarettes, if you pull a cigarette straight up it will come out — but these racks have been distorted. Now when they go to pull the cigarette straight out, it’s going to likely break and release radioactive cesium and other gases, xenon and krypton, into the air. I suspect come November, December, January we’re going to hear that the building’s been evacuated, they’ve broke a fuel rod, the fuel rod is off-gassing.

I suspect we’ll have more airborne releases as they try to pull the fuel out. If they pull too hard, they’ll snap the fuel. I think the racks have been distorted, the fuel has overheated — the pool boiled – and the net effect is that it’s likely some of the fuel will be stuck in there for a long, long time.

I am struck by an image of Japan as a society with no skilled workers or robots, no cameras, trying to accomplish by itself a job that will lead to the Apocalypse if they are off by 1 mm, totally unaware that the job they are facing is complex. The image is not really coming into focus.

Harvey Wasserman adds to this description here:

According to Arnie Gundersen, a nuclear engineer with forty years in an industry for which he once manufactured fuel rods, the ones in the Unit 4 core are bent, damaged and embrittled to the point of crumbling. Cameras have shown troubling quantities of debris in the fuel pool, which itself is damaged.

The engineering and scientific barriers to emptying the Unit Four fuel pool are unique and daunting, says Gundersen. But it must be done to 100% perfection.

Should the attempt fail, the rods could be exposed to air and catch fire, releasing horrific quantities of radiation into the atmosphere. The pool could come crashing to the ground, dumping the rods together into a pile that could fission and possibly explode. The resulting radioactive cloud would threaten the health and safety of all us.

As discussed in the introduction, the pools did not boil. It’s long past the time when there is a possibility that cladding for the fuel rods could catch fire.

Some background is needed to understand how ridiculous the accusation that fission could result from the pool falling. Commercial nuclear reactors use water as a moderator (some use graphite). The basic idea is that uranium-235 fissions when hit by a neutron, and releases a number of neutrons, one of which makes it to another U-235 atom, causing it to fission. Because commercial nuclear reactors have relatively little U-235, they cannot go supercritical like a bomb. Moderators slow neutrons released when uranium fissions, because otherwise the neutron is moving too fast to cause another fission.

Spent fuel is put in water to cool it down, and the water is deep enough to prevent decay particles and fission fragments from making it out. But because water is a moderator, the rods are stored in borated racks. The racks control the geometry, keeping the fuel rods apart, and the boron absorbs neutrons, so that new fissions do not occur. The decay of all the fission fragments goes on for a few years; cooling is needed as those small fission products decay, producing heat.

For the Gundersen scenario of the pool crashing to the ground, dumping the rods together so that they could fission and possibly explode, the following would have to occur:
• structure breaks
• fuel rods fall in exactly the right geometry relative to each other
• the borated racks disappear, so there is no boron and no impediment to the fuel rods falling in the exact right geometry
• the fuel rods fall with exactly the right geometry into a pool of water, providing the needed moderator

The 100% perfection scenario Gundersen described, only everything must go perfectly, improbably, wrong.

The actual procedure will move one bundle at a time into a cask with other bundles. The cask is then shielded and drained, and moved to ground level to a longer term storage facility. If a bundle is dropped, it may break, and there may be pellets scattered on the pool floor. No radioactivity will be released. When all the intact bundles are removed, bundles that presented a problem and any pellets will need to be separately moved. The entire process does not risk fission, nor will there be radiation release.

This step is occurring long before removal to dry cask storage to allow workers to ascertain if any interesting changes occurred in the earthquake, tsunami, or/and soaking with salt water.

Gundersen has a long career of unsupported assertions. There was the time he found very radioactive soil in Tokyo:

Arnie Gundersen, chief engineer with Burlington-based Fairewinds Associates, says he traveled to Tokyo recently, took soil samples from parks, playgrounds and rooftop gardens around the city and brought them back to be tested in a U.S. lab.

He says they showed levels of radioactivity would qualify them as nuclear waste in the U.S.

Nuclear Energy Institute, a U.S. industry lobby, asked Gundersen to share the lab results, perhaps let an independent lab check the results. No luck, Gundersen refused.

Gundersen, when interviewed in June 2011, had apparently forgotten Chernobyl, and the Bhopal disaster (which killed immediately and long term more than Chernobyl), and etc:

Fukushima is the biggest industrial catastrophe in the history of mankind,” Arnold Gundersen, a former nuclear industry senior vice president, told Al Jazeera….

According to Gundersen, the exposed reactors and fuel cores are continuing to release microns of caesium, strontium, and plutonium isotopes. These are referred to as “hot particles”.

“We are discovering hot particles everywhere in Japan, even in Tokyo,” he said. “Scientists are finding these everywhere. Over the last 90 days these hot particles have continued to fall and are being deposited in high concentrations. A lot of people are picking these up in car engine air filters.”

Radioactive air filters from cars in Fukushima prefecture and Tokyo are now common, and Gundersen says his sources are finding radioactive air filters in the greater Seattle area of the US as well.

The hot particles on them can eventually lead to cancer.

“These get stuck in your lungs or GI tract, and they are a constant irritant,” he explained, “One cigarette doesn’t get you, but over time they do. These [hot particles] can cause cancer, but you can’t measure them with a Geiger counter. Clearly people in Fukushima prefecture have breathed in a large amount of these particles. Clearly the upper West Coast of the U.S. has people being affected. That area got hit pretty heavy in April.”

Plutonium was not released. A micron is one millionth of a meter, I’m not sure what a micron of cesium is. No evidence has been found that hot particles that can’t be detected with a Geiger counter are poisoning car air filters around Japan and in Seattle.

Gundersen got a master’s degree in nuclear engineering at the time the Fukushima plant was being built, and is now chief (and only) engineer at Fairewinds, an anti-nuclear group. While he began work in nuclear > 4 decades ago, it is not correct to say that he actually has 4 decades experience.

Harvey Wasserman says this is the most danger the world has been in since the Cuban Missile Crisis

The Truthout article links near the top to an online article in which Harvey Wasserman makes a lot of assertions, most of which don’t make sense.

• Steam indicates fission may be occurring underground.
• Irradiated water could leak from tanks if there is a really large earthquake, without quantifying either the size of the earthquake, the size of the radioactivity (most of the water in the tanks is very low level radioactive), etc. (More on this in part 5.)
• Evidence indicates increased thyroid cancer among children, despite the UN finding no such evidence after extensive testing.
• The GE-designed pool is 100′ up. A lot of this article is anti-Big Biz, so at some point, I began to infer that if GE or another large company designed it, I was supposed to believe that there must be a design flaw.

This is not Wasserman’s first set of predictions. Now the danger is ahead of us, but in 2011 he posited that it may have already happened:

At least one spent fuel pool—in Unit Four—may have been entirely exposed to air and caught fire. Reactor fuel cladding is made with a zirconium alloy that ignites when uncovered, emitting very large quantities of radiation. The high level radioactive waste pool in Unit Four may no longer be burning, though it may still be general.

I’m not sure what the last clause means.

He quotes Ken Buessler saying,

When it comes to the oceans, says Ken Buesseler, a chemical oceonographer at the Woods Hole Oceanographic Institution, “the impact of Fukushima exceeds Chernobyl.”

(typos in original) It is true that Chernobyl was far from any ocean, but apparently Buesseler didn’t and doesn’t think that the effects of Fukushima merit a Cuban Missile Crisis headline.

Fukushima’s owner, the Tokyo Electric Power Company, has confirmed that fuel at Unit One melted BEFORE the arrival of the March 11 tsunami.

NOT.

In 2012, Wasserman corrects the actual facts about Three Mile Island with untruths:

“Nobody died” at Three Mile Island until epidemiological evidence showed otherwise. (Disclosure: In 1980 I interviewed the dying and bereaved in central Pennsylvania, leading to the 1982 publication of Killing Our Own).

A link is provided to his book, which we can buy to learn more.

Harvey Wasserman is senior advisor and website editor for nukefree.org, which was created by 3 musicians (and I love all of them!) to fight nuclear power. Wikipedia says Wasserman has no degrees in science, and that he coined the phrase, “No nukes”.

Summary

All of those warning of the dangers of the fuel rods at Fukushima Dai-ichi—Alvarez, Gundersen, Wasserman, and the others cited in the Truthout article and other articles I’ve seen—say things that aren’t true. Readers, call them on it!

Part 1 Bottom line numbers
Part 2 The state of the evacuation, food and fish
Part 3 The plume and fish come to North America
Part 5 The current state of F-D cleanup

Fukushima update—the plume and fish come to North America, part 3

September 30th, 2013

Some of the oddest accusations about the Fukushima accident imply that it has affected or will affect health of Americans.

Tsunami debris

Marine debris from the tsunami is expected to hit Hawaii this winter, and the US mainland in 2014. This is unrelated to the nuclear accident, but will it have health effects? Harm other species?
marine debris
Marine debris, see NOAA for more information

The plume

A number of unrelated figures, such as this NOAA picture of tsunami height on March 11, 2011, have been alleged to represent a radioactive plume moving east across the Pacific:

Tsunami height becomes radiation?
Snopes says nope, NOAA’s picture of tsunami height is not also a picture of the amount of radioactivity.

The current expectation is that the plume will reach Hawaii in the first half of 2014, and the West Coast of the US some years later. Estimates of Hawaiian radioactivity is 10 – 30 becquerel/cubic meter, but it will be more dilute when it hits the mainland, some 10 – 22 Bq/m3, according to Multi-decadal projections of surface and interior pathways of the Fukushima Cesium-137 radioactive plume. This radioactivity adds to >12,000 Bq/m3 in the ocean water itself (the great majority of this is potassium-40, also a large part of natural radioactivity in our body).

Lots of stuff travels to other hemispheres through the ocean and air—California gets enough Chinese coal pollution to challenge the state’s air pollution standards. (More interesting and less discussed, but why?)

Radioactive fish are traveling as well

The US, like a number of countries, requires tests of food if there is reason to think that food standards might not be met. So far as I know, the US isn’t bothering to test Pacific Ocean fish for radioactivity.

A partial list of odd assertions:

Cecile Pineda, a novelist, has stayed in that genre with her recent discussions of Fukushima. She spoke recently in the SF East Bay on fish purportedly showing signs of radiation disease washing up in Vancouver, Oregon, and LA. Yet as we see below, the major radioactivity in almost all fish traveling to North America is natural.
• The Daily Mail offers radioactivity as an explanation for malnourished seal pups in CA. See the front page of The Daily Mail if you wonder about its general reliability.
• Bluefin tuna caught in CA last August are 10 x as radioactive as normal, according to a Huffington Post interpretation of a paper in the Proceedings of the National Academy of Sciences. NOT. Interestingly, the link the article provided gives different information: the fish, which were young and in Japan at the time of the accident were 5 x as radioactive as normal if you count just the cesium (5 becquerel rather than 1). This is in part because cesium washes out unless the fish keep ingesting it.

The actual facts are not frightening. According to Evaluation of radiation doses and associated risk from the Fukushima nuclear accident to marine biota and human consumers of seafood in the Proceedings of the National Academy of Sciences,

Abstract: Radioactive isotopes originating from the damaged Fukushima nuclear reactor in Japan following the earthquake and tsunami in March 2011 were found in resident marine animals and in migratory Pacific bluefin tuna (PBFT). Publication of this information resulted in a worldwide response that caused public anxiety and concern, although PBFT captured off California in August 2011 contained activity concentrations below those from naturally occurring radionuclides.

To link the radioactivity to possible health impairments, we calculated doses, attributable to the Fukushima-derived and the naturally occurring radionuclides, to both the marine biota and human fish consumers. We showed that doses in all cases were dominated by the naturally occurring alpha-emitter 210Po and that Fukushima-derived doses were three to four orders of magnitude below 210Po-derived doses….

Their report begins,

Recent reports describing the presence of radionuclides released from the damaged Fukushima Daiichi nuclear power plant in Pacific biota have aroused worldwide attention and concern. For example, the discovery of 134Cs and 137Cs in Pacific bluefin tuna (Thunnus orientalis; PBFT) that migrated from Japan to California waters was covered by >1,100 newspapers worldwide and numerous internet, television, and radio outlets. Such widespread coverage reflects the public’s concern and general fear of radiation. Concerns are particularly acute if the artificial radionuclides are in human food items…

The “three to four orders of magnitude” says that the added radioactivity from the Fukushima accident is, give or take, 1,000 – 10,000 times less important than natural radioactivity. The relative interest in bluefin tuna radioactivity over Chinese air pollution in North America appears to be explained in the opening paragraph.

Table 1 provides mean radioactivity decay rates for the following elements:

Bluefin tuna arriving in San Diego, August 2011
cesium (both Cs-134 and Cs-137), 10.3 becquerel/kg dry
potassium-40, 347 Bq/kg dry
polonium-210, 79 Bq/kg dry

Japan, April 2011
cesium, 155 Bq/kg dry
potassium-40, 347 Bq/kg dry
polonium-210, 79 Bq/kg dry

The polonium will have significantly more health effects per becquerel—polonium is an alpha emitter, stored differently in the body, etc.

In the same table, the authors assume that Americans get their entire average annual sea food consumption, 24.1 kg = 53 pounds/year, from bluefin tuna, and calculate health effects. They do the same for the Japanese, assuming 56.6 kg = 125 pounds consumption/year. It is not clear that the authors consider how long radioactive atoms remain in our body, since we excrete them along with other atoms; the numbers below may overstate the case as the authors assume a residence time as long as 50 years.

San Diego, August 2011
cesium, 0.9 µSv (microsievert, see Part 2 for more on units)
potassium-40, 12.7 µSv
polonium-210, 558 µSv

in Japan April 2011
cesium, 32.6 µSv
potassium-40, 29.7 µSv
polonium-210, 1,310 µSv

Radioactivity due to cesium in tuna, in Japanese waters and elsewhere, has declined dramatically since 2011.

Bottom line

The accident at Fukushima added an insignificant level of radioactivity to that already in seawater and fish, at least for those of us who are far away. As mentioned in Part 2, a small number of bottom feeders in the area immediately adjacent to the plant have levels of radioactivity which don’t meet international standards.

A good portion of the American Fukushima discussion I’m seeing asks, “How will Fukushima affect me?” The answer: if it is unhealthy for Americans, the effects in Japan would be more dramatic. Contrast this with Chinese air pollution, affecting CA air quality after killing many hundreds of thousands yearly in China.

Part 1 Bottom line numbers
Part 2 The state of the evacuation, food and fish
Part 4 The history of predictions on spent fuel rods
Part 5 The current state of F-D cleanup

Fukushima updates on evacuation, food, and fish, part 2

September 28th, 2013

What is happening with the Fukushima evacuation, and how the radioactivity in Fukushima compares to other places people visit and live. The cleanup, food and fish, and the cost of increased use of fossil fuels.

Many places in the world have high natural background radiation

According to World Nuclear Association,

Naturally occurring background radiation is the main source of exposure for most people, and provides some perspective on radiation exposure from nuclear energy. The average dose received by all of us from background radiation is around 2.4 mSv/yr, which can vary depending on the geology and altitude where people live – ranging between 1 and 10 mSv/yr, but can be more than 50 mSv/yr. The highest known level of background radiation affecting a substantial population is in Kerala and Madras states in India where some 140,000 people receive doses which average over 15 millisievert per year from gamma radiation, in addition to a similar dose from radon. Comparable levels occur in Brazil and Sudan, with average exposures up to about 40 mSv/yr to many people. (The highest level of natural background radiation recorded is on a Brazilian beach: 800 mSv/yr, but people don’t live there.)

Several places are known in Iran, India and Europe where natural background radiation gives an annual dose of more than 100 mSv to people and up to 260 mSv (at Ramsar in Iran, where some 200,000 people are exposed to more than 10 mSv/yr).

Units* are explained at the end of this post.

That list is far from complete; there are a number of other places with high background radioactivity:
Finland, population 5.4 million, almost 8 millisievert each year (mSv/year)
• parts of Norway over 10 mSv/year
Yangjiang, China population 2.6 million > 6 mSv/year
Denver 2.6 million, 11.8 mSv/year
Arkaroola, South Australia, 100 x more radioactive than anywhere else in Australia. The hot springs are hot because of radioactive decay!
• Guarapari, Brazil where the black sand on the beach comes in at 90 µSv/hr using the 800 mSv/year figure above, but higher recordings have been seen, up to 130 µSv/hr. People are permitted to sit where they will on the beach without wearing any special hazmat outfit.
• Radon was first discovered as a major portion of our exposure when Stanley Watras triggered the alarm at his local nuclear power plant. His basement was more than 800 µSv/hour.
• Etc… Cornwall … etc…southwest France…etc…
• Air travel increases our exposure to radioactivity, by about 4 – 7 µSv/hour, more for the Concorde NY to Paris route.

Numbers provided by different sources vary for a number of reasons. Some sites don’t include our own internal radioactivity, about 0.4 mSv/year. Some look at maximum, some look at maximum people actually live with, some average.

Japanese evacuation categories

Over 160,000 were evacuated in 2011. The Japanese government only allowed return to begin in 2012 where yearly dose would be less than 20 mSv/year the first year back, although decontamination would continue. Restrictions exist for areas not expected to drop below 20 mSv/year by March 2016, 5 years after the accident, and include about half the 20 km (12 mile) evacuation zone. As of now, all towns can be visited, although some visits are restricted, including Futaba, the town closest to the plant, where many houses were destroyed by the tsunami.

The Japanese government has 4 categories for evacuation:
—difficult-to-return zones, with evacuation expected to be at least 5 years from March 2012
—no-residence zones, where people will be able to return earlier
—zones preparing for the evacuation order to be lifted
—planned evacuation zone, “a high-risk zone to the northwest of the plant and outside the 20-kilometer radius that is yet to be reclassified into any of the three other categories.”

   Dose equivalent 11/2011  Dose equivalent 3/2013  Dose equivalent at 3/2013 level
   µSv/hr  µSv/hr  mSv/year
 Difficult to return  14.5  8.5  74
 No-residence  5.7  3.7  32
 Evacuation order to be lifted  2.0  1.1  9.6
 Planned evacuation zone  2.7  1.5  13


Table: Radioactivity decline over 17 months.

Of course, the level of radioactivity will continue to decline. This rate of radioactivity decrease is about the same as was seen in the areas around Chernobyl, where cesium declined with a half life of 0.7 – 1.8 years; decline in the zones around the Fukushima plant was about 40% in 1.6 years. The areas around Chernobyl saw a rapid decrease for 4 – 6 years, so it would not be surprising if by January 2015, all rates had dropped by half, and by November 2016, all rates dropped by half again, even without special clean up work. The difficult to return zones would expect to see an average of 2.1 µSv/hr, or a temporary rate of 19 mSv/year, or less, by November 2016. Assuming the Japanese experience is the same as in the areas around Chernobyl, the rate should continue to decline rapidly between 2011 and 2015 – 2017.

To get some idea of radioactivity in the area northwest from the Fukushima-Daiichi plant, go to this map which is updated frequently (although we are unlikely to see any change day to day). Note that you can get more detailed information by placing your cursor over the sites; the most radioactive site at the end of September 2013 was 26 µSv/hr. The sensors are in place and sending information to the Japanese NRA (nuclear regulatory agency).

Note: nowhere on this map is as radioactive as a number of places where people travel freely, such as Guarapari, Brazil or Ramsar, Iran.

How is Japan doing on the cleanup?

In November 2011, a team from International Atomic Energy Agency thought that Japan deserved good grades for prompt attention to cleanup, and poor grades for setting reasonable priorities.

In practical terms this translates to focusing on the quickest dose reduction, without unwanted side effects like classifying millions of tonnes of very lightly contaminated topsoil as ‘radioactive waste’. It may be desirable to remove this soil from childrens’ playgrounds, for example, but some of the material may pose no realistic threat to health and could be recycled or used in construction work, said the IAEA team.

Another point of consideration is the handling of large open areas like forests. “The investment of time and effort in removing contamination beyond certain levels… where the additional exposure is relatively low, does not automatically lead to a reduction of doses for the public.” Japanese authorities have already noted that removing some contaminated leaf mold could have a greater harmful effect on some parts of the ecosystem.

The Japanese appear to be spending lots of money to bring the level of radioactivity well below 20 mSv/year, at best only partially following IAEA recommendations:

A further 100 municipalities in eight prefectures, where air dose rates are over 0.23 µSv per hour (equivalent to over 1 mSv per year) are classed as Intensive Decontamination Areas, where decontamination is being implemented by each municipality with funding and technical support from the national government.

Work has been completed to target levels in one municipality in the Special Decontamination Areas: Tamura, where decontamination of living areas, farmland, forest and roads was declared to be 100% complete in June 2013. Over a period of just under a year, workers spent a total of 120,000 man days decontaminating nearly 230,000 square metres of buildings including 121 homes, 96 km of roads, 1.2 million square metres of farmland and nearly 2 million square metres of forests using a variety of techniques including pressure washing and topsoil removal.

Meanwhile, other municipalities hope to receive the classification and the money that goes with it.

What about the food?

Japan allows less radioactivity in the food and water than many other parts of the world. For example, Japan before the accident set their water safety level at 1/5 the level of the European standard, and then lowered it further. Their assumptions of the health effect of various decay rates for food and water appear to me to assume that radioactivity from food and water comes in, but never leaves.

The US standard is 1,200 Bq/L for water, and 1,250 Bq/kg (570 Bq/pound) for solid food.

The World Health Organization standard for infants is 1,600 Bq/L radioactive iodine, and 1,800 Bq/L radioactive cesium (table 6 here).

Similarly the Japanese food standard for radioactivity began lower than that in other countries, and the Japanese lowered it even further. This has repercussions for Japanese farmers—more than a year ago, 30 out of almost 5,000 farms in the relatively contaminated areas farmed rice too radioactive to sell, although it would be safe according to standards elsewhere, but by imposing even more rigorous standards, 300 farms would encounter problems selling their rice.

• The new standards for Japan are 10 Bq/L water, 50 Bq/L milk (because the Japanese drink less milk), and 100 Bq/kg (new standards) for solid foods.

“Scientists say [the much higher international] limits are far below levels of contamination where they can see any evidence of an effect on health.”

There are a number of foods naturally more radioactive than the new Japanese standard, for example Brazil nuts can be as much as 440 Bq/kg. Even though Bq is a decay rate and not a health effect, the health effect from cesium decay and other radioactive atoms normally in food, like potassium, is the same.

From a Woods Hole article on seafood,

In one study by the consumer group Coop-Fukushima, [Kazuo Sakai, a radiation biophysicist with Japan’s National Institute of Radiological Sciences,] reported, 100 Fukushima households prepared an extra portion of their meals to be analyzed for radioactivity. The results showed measurable amounts of cesium in only three households, and in all cases showed that naturally occurring radiation, in the form of potassium-40, was far more prevalent.

The article contains a statement by a Japanese pediatric oncologist, recommending massive removal of top soil, etc so that levels of radioactivity were below natural background in the US, with the idea of reassuring Japanese citizens.

Ironically, some suggested, the Japanese government’s decision to lower acceptable radiation limits in fish may have actually heightened consumer fears instead of dampening them. Deborah Oughton, an environmental chemist and ethicist at the Norwegian University of Life Sciences, related that the Norwegian government, when faced with high radioisotope concentrations in reindeer meat as a result of Chernobyl, decided to raise acceptable limits from 600 to 6,000 becquerels per kilogram. The move was made, she explained, to protect the livelihood of the minority Sami population that depends on reindeer herding for its survival.

Weighed into the judgment, she added, was the issue of dose: The hazard involves not only how high the levels are in meat, but how much you eat—and Norwegians rarely eat reindeer meat more than once or twice a year. The decision had no impact on sales of reindeer meat.

The larger point, Oughton said, “is that public acceptance with regard to these issues comes down to more than becquerels and sieverts. It is a very complex issue.” And nowhere more complex than in Japan. Alexis Dudden of the University of Connecticut offered a historian’s perspective when she suggested that “both at the local level and the national level, some discussion needs to take into consideration Japan’s particular history with radiation.”

What about the fish?

According to the KQED interview with Matt Charette (minute 14:15 – 15), 20% of fish obtained near Fukushima prefecture come in at above the Japanese standards.

The Japanese allow 100 Bq/kg fish, <1/10 as much radioactivity as Americans (and everyone else). Within 20 km (12 miles) of the plant, they are finding that 40% of the bottom dwelling fish off Fukushima don’t meet the Japanese standards. While most of these will meet international standards, two greenling caught in August 2012 came in at 25,000 Bq/kg (subscription needed).

All fish, particularly the bottom dwelling fish are tested from this region and those that flunk are not sold in Japan or exported.

According to Fukushima-derived radionuclides in the ocean and biota off Japan, in Proceedings of the National Academy of Sciences, the level of cesium in fish would need to be about 300 – 12,000 Bq/kg to become as important as the radioactive polonium-210 found in various fish species. Potassium-40 is also an important source of radioactivity in ocean fish. Only a small portion of fish tested in 2011 had become half as much more radioactive than ocean fish are naturally. Eating 200 gram piece of fish (typical restaurant portion) at >200 Bq cesium/kg is equivalent to eating an uncontaminated 200 g banana.

Fishing has begun again off the coast:

Out of 100 fish and seafood products tested, 95 were clear of radioactive substances and the remaining five contained less than one-10th of the government’s limit of 100 becquerels for food products, it added.

Cost of switching to fossil fuels

Japan is now operating full time old power plants meant to operate while the nuclear plants are down, and it is challenging to keep them on. Much of the $40 billion annual increase in the cost of fossil fuels (to $85 billion) since March 2011 is due to replacing nuclear power with fossil fuels.

Japan’s greenhouse gas emissions are up about 4%, even with reduced electricity available, 10% for electricity.

* Units: One microsievert (µSv) = 1 millionth of a sievert. One millisievert (mSv) = 1 thousandth of a sievert. The model predicts approximately for the general population that 10 man Sieverts = 1 cancer, 20 man Sieverts = 1 death. Most major organizations assume a lower health effect for low doses (below 100 mSv or below 10 mSv) or for a low dose rate.

Sieverts include decay rate, type of decay (some types of decay do more damage), and tissue type—they are a health effect.

There are 8,760 hours/year. Multiply values for µSv/hour by 8.76 to get mSv/year. Since radioactivity is disappearing rapidly from the area around Fukushima-Daiichi, round down a bunch to get your actual exposure over the next year if you move back today.

Part 1 Bottom line numbers
Part 3 The plume and fish come to North America
Part 4 The history of predictions on spent fuel rods
Part 5 The current state of F-D cleanup