Archive for April, 2007

IPCC WG1

Sunday, April 29th, 2007

The full report (most of it) for Intergovernmental Panel on Climate Change Working Group 1: The Physical Basis is now available.

Recommendation to newbies: start with either the Summary for Policymakers or Technical Summary. These reference chapter sections that provide more information on topics that interest.

Steven Chu talks on energy choices

Tuesday, April 24th, 2007

Last night a 12-year old friend and I attended the first in a free series of energy lectures in downtown Berkeley, courtesy of Lawrence Berkeley Labs. Paul Alivisatos will speak May 7 on Nanoscience at Work: Creating Energy from Sunlight, Jay Keasling June 4 on Renewable Energy from Synthetic Biology. Alivisatos and Keasling lead LBL’s Helios Project, turning sunlight into fuels.

Steven Chu, Nobel Prize winner in physics, left his field to head a national lab because his new interest is The Energy Problem: What the Helios Project Can Do about It — climate change and cellulosic biofuels. This will be the subject of an upcoming blog.

[The Nobel Prize was awarded for his method of slowing atoms down to a fraction of a degree above absolute zero. Imagine an atom that can only move left or right. Shine a laser light on it from both directions. Because of the Doppler effect, the atom will see one source of light as higher frequency, the other as lower frequency. The higher frequency light has greater momentum, and will give a larger push to the atom, slowing it down. In our 3-dimensional universe, six lasers are needed.]

LBL posts the talks, Chu’s is here.

A couple of interesting details:

• Between 50 and 100% of today’s US fuels could be produced by using agricultural waste plus growing crops on 50 million acres, a portion of land a little larger than Nebraska. This kind of crop would be ideal for degraded and marginal land. It would be low input (water and fertilizer) but help restore the soil. Note: fuel consumption is rising, so we need to find a way to bring this down through greater fuel economy, and perhaps through using plug-in hybrids, so that low-carbon electricity provides some of the energy. Also, predictions about yields in a changing climate are more iffy than we want them to be.

• Radiation release from nuclear power is less than that from coal. I knew that an operating coal plant releases 100 times more radiation than a similar size nuclear power plant. [Coal contains heavy metals — uranium, thorium, mercury and others. Uranium and thorium are the main source of the radioactivity release, but health problems from the release of mercury are of more concern than the heavy metal plus radiation from uranium + thorium.] What I missed in reading this article is that a coal power plant in normal operation releases 4 times as much radioactivity as a nuclear power plant from mining to operation to waste disposal, this number rises if radioactivity release from coal mining (unknown) is included.

• Average glacier thickness decreased 14 meters (45 feet) in the last 50 years. Gulp. The Tibetan glacier is shrinking 1.2 meters, 4 feet, each year.

Richard Cizik on the environment and Biblical mandate

Monday, April 23rd, 2007

The Washington Post has a whole series on faith, differing views on an entire range of topics. Here is Cizik on the environment:

Participation in [Earth Day] is an opportunity to express love for God and care for what He has created. We evangelicals call this “creation care.” Care for the entire creation — the environment and “all creatures great and small” — is a biblical obligation (Gen. 2:15). We should walk in God’s ways (Deut. 10:12) and try to inspire people by offering broader vistas of thought and service.

Can we hear the voice of the biblical prophet Ezekiel: “Is it not enough for you to drink the water? Must you also muddy the rest with your feet?” Here’s a modern-day question: Is it enough for you to enjoy a pleasant climate? Must you destroy it? Is it not enough for you to enjoy the myriad of creatures? Must you extinguish them? Major segments of the earth are dying and we are responsible. Earth’s resources are not infinite.

The comments so far are, “yes, caring for the Earth and its people is a Christian duty”, and “it is the duty of all of us”.

Mercury in compact fluorescent light bulbs

Friday, April 20th, 2007

I just did a series of presentations in Tempe, AZ, had a wonderful time, hope to post more.

One night, the question of mercury in compact fluorescent bulbs generated a bit of discussion.

Sources of Mercury Emissions
Sources of Mercury Emissions include coal power plants (utility boilers), cement, landfills, etc. The addition of mercury to the environment is declining; after peaking in 1960, emissions have fallen more than half. US emissions dropped by 1/3 just in the 1990s. This is because mercury use is less common.

The contribution of mercury from compact fluorescents is small, smaller than the contribution of incandescent bulbs lit in part by coal power.

Heavy metal poisoning can be serious, that said, I’m not sure why mercury has grabbed the public interest, though I see environmentalist groups pushing this concern. Not to mention the US government’s focus on cleaning up coal emissions of mercury, with less public discussion of the more potent killers from coal power. While coal is the single biggest contributor to mercury in the air, mercury is far down the list of coal’s sins. Carbon dioxide, causing climate change, particulates, killing some 30,000 Americans annually and hundreds of thousands of Chinese, and ozone, killing 1,000 Americans annually and ?? Chinese, certainly are more important than mercury. Incandescent bulbs use about 4 times the electricity and create 4 times the number of deaths and illnesses, of which mercury is a minor portion.

Compact fluorescent
Compact fluorescent bulbs save lives.

Incadescent bulbs
Incandescent bulbs are costly. If your electricity is made from coal or natural gas, incandescent bulbs are important contributors to mortality rates, environmental destruction, and a small increase in mercury emissions (though larger than the contribution from compact fluorescents).

Switching your bulbs
Switching your bulbs to compact fluorescent is a good idea!

Dispose of your light bulbs as specified locally. In some places, this means collecting them until other stuff is taken in for processing. In others, it means throwing compact fluorescents out with the trash, unless you generate more than 100 kg in hazardous waste/month.

How dangerous is mercury?
It, along with cadmium, arsenic, and lead, would not be commercially affordable if they had to meet the same standards as uranium. That said, avoid breaking CFL’s regularly and there shouldn’t be too much problem. The old mercury thermometers had between 10 and 800 times as much mercury as a compact fluorescent bulb. The Japanese problems with mercury poisoning from fish occurred after industrial dumping. Don’t go out of your way to eat mercury, but don’t worry too much about the levels of mercury in CFL’s either.

Climate Forcings

Thursday, April 19th, 2007

Why focus so much on carbon dioxide so often when there are other forcings?

1) It’s a lot easier to say carbon dioxide than radiative forcings, fewer blank looks.

Radiative forcings affect the radiation balance of the Earth. Before the industrial revolution, radiation in (light, including visible, infrared, and ultraviolet) was the same as radiation out.

Examples of direct forcings:

• CO2 and other greenhouse gases absorbs some of the infrared (a greater part of radiation out than radiation in) and re-emits it. About half is re-emitted down, rather than up.
• land-use change can increase albedo (the portion of light reflected) by removing darker trees. This is a negative feedback.

Example of indirect forcings, which alter the climate first:
• Added aerosols (gaseous suspension of fine solid or liquid particles) modify precipitation efficiency of clouds, changing the radiative property of clouds.

2) Adding all the positive and negative forcings together gives a total forcing about the same as carbon dioxide alone.

3) Carbon dioxide is the fastest growing forcing.

The IPCC 2007 Summary for Policymakers: The Physical Science (go to IPCC and download WG1–working group 1) has a more detailed figure of Radiative Forcing Components, here is a simplified version without error bars:

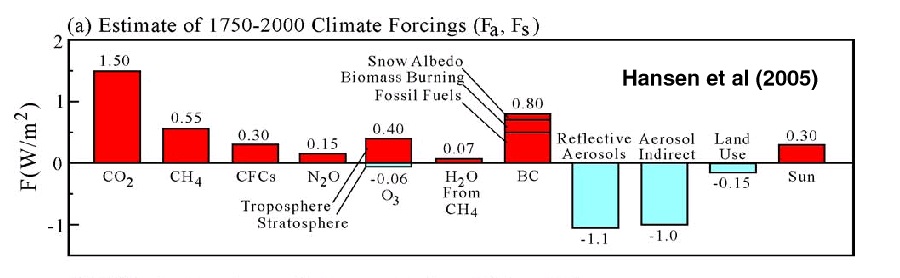
Estimate of 1750-2000 Climate Forcings

Interpreting the figure
The net increase in forcings from 1750 is 1.7 W/m2, the same as adding a 1.7 W bulb over every square meter of Earth, land and sea, 24 hours/day. This is just a little more than the contribution from carbon dioxide.

Methane, CH4, contributes a good chunk. Natural gas is primarily methane, leaked into the atmosphere in the process of getting any fossil fuel. Chlorofluorocarbons (which also destroy the ozone layer) and N20, (nitrous oxide, also an ozone destroying gas), primarily from nitrogen fertilizers, animal waste, and industry, and ozone are also important. Together, these gases have contributed 2/3 as much as carbon dioxide since 1750. Better control of methane emissions and banning of CFCs through much of the world are decreasing the importance of these GHGs in today’s emissions.

Methane’s contribution in the cumulative emissions figure was about 33% of carbon dioxide’s.

Methane's current contribution
Methane’s current contribution is lower, about 29% as much as carbon dioxide.

Methane emissions in the US
Methane emissions in the US are about 1/9 of carbon dioxide emissions from burning fossil fuels.

US Methane Projections
US Methane Projections are expected to stay more or less the same even with no voluntary behavior change, and decline by 10% with voluntary changes; presumably faster declines are possible.

Changes since 1750 to stratospheric ozone have had a negative forcing, because we’ve destroyed part of the ozone layer. The ground layer ozone we’ve added has had a strong positive forcing.

About half as important as carbon dioxide is black carbon, from burning fossil fuels and biomass (eg, trees). Soot on snow has changed the reflectivity, leading to greater warming, about 0.1 W/m2. A brighter sun has added 0.1 W/m2 according to the latest IPCC report, less than the Hansen estimate.

The Earth has cooled (temporarily, anyway) because of the reflective aerosols we have added. IPCC estimates that the direct effect has been to increase how much sunlight is reflected off the Earth, an effect of -0.5 W/m2, and the indirect effect from changing cloud albedo has led to another -0.7 W/m2 change.

Feedback
Feedbacks are positive if they reinforce the direction of change, and negative if they counter it. If the temperature rises/falls, the amount of permanent snow in polar regions decreases/increases, reducing/increasing the percentage of sunlight reflected. Both represent positive feedback.

Other examples:
• A warmer climate leads to darker plants which absorb more sunlight.
• A warmer climate reduces the amount of carbon dioxide stored in trees, or in the soil.
• A warmer climate increases cloud reflectivity — this would be an example of negative feedback.

While climatologists are unsure of how important various positive and negative feedback mechanisms will be, they are confident that positive feedback will be more important than negative feedback, and that it will be significant.

There is great worry about the release of carbon dioxide (under aerobic conditions) and methane (under anaerobic) from warming soil. We are not there yet:

Global methane emissions
Global methane emissions do not yet include a substantial contribution from warming soil.

From Methane to Markets:

China, India, the United States, Brazil, Russia, and other Eurasian countries are responsible for almost half of all anthropogenic methane emissions. Methane emission sources vary significantly among countries. For example, the two key sources of methane emissions in China are coal mining and rice production. Russia emits most of its methane from natural gas and oil systems; India’s primary sources are rice and livestock production; and landfills are the largest source of U.S. methane emissions.

However, positive feedbacks (which may include methane and carbon dioxide from warming soil) are becoming increasingly important. From the IPCC 2007 Summary for Policymakers: The Physical Science:

…model studies suggest that to stabilise at 450 ppm carbon dioxide, could require that cumulative emissions over the 21st century be reduced from an average of approximately 670 [630 to 710] GtC (billion metric tonnes carbon) to approximately 490 [375 to 600] GtC.

Skeptic Spam?

Saturday, April 7th, 2007

Someone told me that she is seeing climate change skeptic commenters active everywhere, and asked if they are being paid.

I know that the skeptic comment after the IPCC report post came in through the normal spam route, without going through the main page. Add in the phony return address — is this the same as any other spam? What are the rest of you seeing?

The personal skeptics I know like to talk about their skepticism a lot; perhaps that is why I didn’t notice the big increase.

John Holdren’s plenary address to AAAS

Saturday, April 7th, 2007

John Holdren, outgoing president of the American Association for the Advancement of Science, addressed the annual meeting on the big issues: human welfare, the environment, climate change, and nuclear proliferation. You can watch him speak or download the PowerPoint presentation from the AAAS site.

This is one of the most powerful summaries I’ve heard of how well we are succeeding in these four different areas, and what we can do differently and better.

Really Scary Numbers — Stern Review

Saturday, April 7th, 2007

The Stern Review on the Economics of Climate Change was released February 12.

Go to page 5 of the executive summary.

Currently, atmospheric levels of greenhouse gases (GHG) are 450 parts per million (ppm). This includes 382 ppm CO2. Relative to pre-industrial times, the temperature of the Earth has increased 0.8 C. The authors of the Stern Review feel that keeping atmospheric levels of greenhouse gases to 450 ppm is almost out of reach, and that it will cost 1% of the worldwide Gross Domestic Product to keep GHG levels to levels between 500 and 550 ppm.

Stabilization Levels and Probability Ranges for Temperature Increases

At 450 ppm carbon dioxide equivalent (CO2e), there is a 50% chance that the temperature increase relative to pre-industrial times will be 2 C or more, a 5% chance that it will anywhere from 3.8 C to more than 5 C. At 550 ppm CO2e, there is a 50% chance that temperature increase will be greater than 2.9 C, and a 5% chance that it will be grater than 3.8, perhaps much greater than 5 C. Notice that these probability models show asymmetric results — the 50% or 5% highest temperature increases are spread over a much larger range than the lowest counterparts.

On the same graph, there are burning embers: relative risks at different temperature increases of consequences for food, water, ecosystems, extreme weather events, and risks of rapid climate change and major irreversible impacts (weakening of currents or melting of the world’s large ice sheets).

These yellow to red give a sense of the results of studies and models — by the red region, large numbers of studies or models give a certain prediction. This does not mean that the collapse of the West Antarctic Ice Sheet is unlikely to happen (or be committed to) before the orange region, say.

Really Scary Numbers — IPCC

Saturday, April 7th, 2007

Two recent reports have numbers scarier than the usual.

Yesterday, the Intergovernmental Panel on Climate Change released the Summary for Policy Makers: Impacts, Adaptation and Vulnerability.

Whatever your newspaper or TV summary of the summary, reading this completely through is scarier. One from each region of the world:

Africa
• Agricultural production, including access to food, in many African countries and regions is projected to be severely compromised by climate variability and change. The area suitable for agriculture, the length of growing seasons and yield potential, particularly along the margins of semi-arid and arid areas, are expected to decrease. This would further adversely affect food security and exacerbate malnutrition in the continent. In some countries, yields from rain-fed agriculture could be reduced by up to 50% by 2020.

Asia
• Freshwater availability in Central, South, East and Southeast Asia particularly in large river basins is projected to decrease due to climate change which, along with population growth and increasing demand arising from higher standards of living, could adversely affect more than a billion people by the 2050s.

Australia and New Zealand
• Significant loss of biodiversity is projected to occur by 2020 in some ecologically-rich sites including the Great Barrier Reef and Queensland Wet Tropics. Other sites at risk include Kakadu wetlands, south-west Australia, sub-Antarctic islands and the alpine areas of both countries.

Europe
• Nearly all European regions are anticipated to be negatively affected by some future impacts of climate change and these will pose challenges to many economic sectors. Climate change is expected to magnify regional differences in Europe’s natural resources and assets. Negative impacts will include increased risk of inland flash floods, and more frequent coastal flooding and increased erosion (due to storminess and sealevel rise). The great majority of organisms and ecosystems will have difficulties adapting to climate change. Mountainous areas will face glacier retreat, reduced snow cover and winter tourism, and extensive species losses (in some areas up to 60% under high emission scenarios by 2080).

Latin America
• By mid-century, increases in temperature and associated decreases in soil water are projected to lead to gradual replacement of tropical forest by savanna in eastern Amazonia. Semi-arid vegetation will tend to be replaced by arid-land vegetation. There is a risk of significant biodiversity loss through species extinction in many areas of tropical Latin America.

North America
• Coastal communities and habitats will be increasingly stressed by climate change impacts interacting with development and pollution. Population growth and the rising value of infrastructure in coastal areas increase vulnerability to climate variability and future climate change, with losses projected to increase if the intensity of tropical storms increases. Current adaptation is uneven and readiness for increased exposure is low.

Polar Regions
• In the Polar Regions, the main projected biophysical effects are reductions in thickness and extent of glaciers and ice sheets, and changes in natural ecosystems with detrimental effects on many organisms including migratory birds, mammals and higher predators. In the Arctic, additional impacts include reductions in the extent of sea ice and permafrost, increased coastal erosion, and an increase in the depth of permafrost seasonal thawing.

Small Islands
• Climate change is projected by the mid-century to reduce water resources in many small islands, e.g., in the Caribbean and Pacific, to the point where they become insufficient to meet demand during low rainfall periods.

Sheep Albedo Paradox

Sunday, April 1st, 2007

For a light-hearted look at climate change, see the April 1 post of RealClimate:

The hypothesis begins with the simple observation that most sheep are white, and therefore have a higher albedo than the land on which they typically graze (see figure below). This effect is confirmed by the recent Sheep Radiation Budget Experiment. The next step in the chain of logic is to note that the sheep population of New Zealand has plummeted in recent years. The resulting decrease in albedo leads to an increase in absorbed Solar radiation, thus warming the planet.