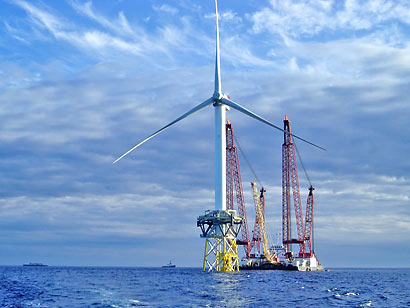
A new report (pdf) from the US Dept. of Energy, based on research by National Renewable Laboratory and others, presents the encouraging conclusion that (if we get our act together immediately) 20% of 2030 US electricity could come from wind power, from about 1% of a lesser amount of electricity today.
The modeling done for this report estimates that wind power installations with capacities of more than 300 gigawatts (GW) would be needed for the 20% wind in 2030 scenario. Increasing U.S. wind power to this level from today’s 11.6 GW level would require significant changes in transmission, manufacturing and markets. This report presents an analysis of one specific scenario for reaching the 20% level and contrasts it to a scenario of no wind growth beyond the level in 2006. Major assumptions in the analysis have been highlighted throughout the document and have been summarized in the appendices. These assumptions may be considered optimistic…..
To successfully address energy security and environmental issues, the nation needs to pursue a portfolio of energy options. None of these options by itself can fully address these issues; there is no “silver bullet.” This technical report examines one potential scenario in which wind power serves as a significant element in the portfolio. However, the 20% Wind Scenario is not a prediction of the future. Instead, it paints a picture of what a particular 20% Wind Scenario could mean for the nation.
Currently US wind capacity is closer to 17 GW (1 GW = 1,000 MW), with a capacity factor over 30%–numbers are changing fast!
The increase in wind power would, according to this scenario, decrease natural gas use for electricity in 2030 by 50% (national total demand by 11%), and coal by 18%. Liquefied natural gas imports from Iran, Qatar, and Russia would decrease over the low-wind scenario.
Assumptions:
wind technology development is projected to continue based on a history of performance improvements. The national transmission system is assumed to evolve in ways favorable to wind energy development by shifting toward large regional markets. In addition, future environmental study and permit requirements are not expected to add significant costs to wind technology.
That is, there will be “significant changes in transmission systems”, the cost of integrating wind into the grid on a large scale includes transmitting wind long distance, and only half of the cost of the transmission lines is put into wind’s column. Does anyone know if this is a reasonable prediction? New transmission lines are expensive, $1,600/megawatt-mile.
Example: A 1,000 MW wind farm 100 miles from the city it services will cost about $160 million, and 100 miles is an optimistic assumption, as wind will be transported a thousand miles or more. The current costs of the windmills would be $1.75 billion. So the 100 miles of transmission lines add about 10% to that cost. The report assumes that new capacity will add 50 miles per MW within regions, and 178 miles across regions.
Assumption: cost could be 6 – 10 cent/kWh for wholesale price including new transmissions lines. The extra cost over the low-wind scenario would be $43 billion between now and 2030, about 0.06 cent/kWh.

Current wind resources and transmission lines
More assumptions: Much of the 2030 wind would be offshore, 18%, though installation won’t begin for a decade.
New fossil fuel kWh prices are expected to increase, with the use of combined cycle gas and integrated gasification combined cycle coal.
Turbine technology will continue to improve (improved reliabilitiy, and BIGGER).
Capacity factor increases from 30% to 45%. This comes from improving windmills and siting them in areas with wind resource power class 5 or higher, or shallow offshore sites of class 4 or greater (reduced wind turbulence over oceans).
Land will be needed:
Altogether, new land-based installations would require approximately 50,000 square kilometers (km2) of land, yet the actual footprint of land-based turbines and related infrastructure would require only about 1,000 to 2,500 km2 of dedicated land—slightly less than the area of Rhode Island.
[To compare: the continental US is 8 x 10^6 km2. 50,000 km2 is twice the size of Maryland or half the size of Virginia.]
Major advantages: essentially no GHG emissions, no air pollution.
The particular scenario they look at would lower emissions in 2030 by 825 million metric tonnes and have a cumulative effect by 2030 of 7,600 million metric tonnes. [So keeping atmospheric levels of CO2 3.5 ppm lower.]
20% Wind Scenario: Major Challenges
• Investment in the nation’s transmission system so the power generated is delivered to urban centers that need the increased supply;
• Larger electric load balancing areas, in tandem with better regional planning, so that regions can depend on a diversity of generation sources, including wind power;
• Continued reduction in wind capital cost and improvement in turbine performance through technology advancement and improved manufacturing capabilities; and
• Addressing potential concerns about local siting, wildlife, and environmental issues within the context of generating electricity.


