Archive for the ‘General’ Category

Moscow was hot in 2010

Thursday, October 27th, 2011

Moscow was hot in 2010, and there were boucoup forest fires. But was it climate change?

Moscow in July
Moscow in July

A new study says a definite “could be”:

We conclude that the 2010 Moscow heat record is, with 80% probability, due to the long-term climatic warming trend.

It wasn’t just Moscow. According to an article in Science Express,

The summer of 2010 was exceptionally warm in eastern Europe and large parts of Russia. We provide evidence that the anomalous 2010 warmth that caused adverse impacts exceeded the amplitude and spatial extent of the previous hottest summer of 2003. “Mega-heatwaves” such as the 2003 and 2010 events broke the 500-year-long seasonal temperature records over approximately 50% of Europe. According to regional multi-model experiments, the probability of a summer experiencing “mega-heatwaves” will increase by a factor of 5 to 10 within the next 40 years. However, the magnitude of the 2010 event was so extreme that despite this increase, the occurrence of an analogue over the same region remains fairly unlikely until the second half of the 21st century.

Outdoor air pollution kills 1.3 million each year

Wednesday, September 28th, 2011

World Health Organization has issued a new report on the health effects of particulates (the small unburned particles released when fossil fuels and biomass are burned).

Air pollution levels in cities with population over 100,000 and capital cities
Map of air pollution levels in cities with population over 100,000 and capital cities
larger image

WHO says:

• Indoor air pollution is estimated to cause approximately 2 million premature deaths mostly in developing countries. Almost half of these deaths are due to pneumonia in children under 5 years of age.
• Urban outdoor air pollution is estimated to cause 1.3 million deaths worldwide per year. Those living in middle-income countries disproportionately experience this burden.

From the report:

PM10 particles, which are particles of 10 micrometers or less, which can penetrate into the lungs and may enter the bloodstream, can cause heart disease, lung cancer, asthma, and acute lower respiratory infections. The WHO air quality guidelines for PM10 is 20 micrograms per cubic metre (µg/m3) as an annual average, but the data released today shows that average PM10 in some cities has reached up to 300 µg/m3.

The 1 1/3 million who died from outdoor air pollution in 2008 is an increase of 200,000 over the 2004 estimate (due to increases in air pollution and numbers living in urban areas, as well as improved data). The recommended level of 20 µg/m3 is better, but not healthy: 250,000 people would have died if particulate pollution everywhere stayed below that level.

In both developed and developing countries, the largest contributors to urban outdoor air pollution include motor transport, small-scale manufacturers and other industries, burning of biomass and coal for cooking and heating, as well as coal-fired power plants. Residential wood and coal burning for space heating is an important contributor to air pollution, especially in rural areas during colder months.

Measurements were made in 2003 – 2010; the majority were from 2008 – 2009.

WHO also discusses other pollutants, such as ozone, NO2 and SO2, but gives mortality in a different format:

Ozone

Excessive ozone in the air can have a marked effect on human health. It can cause breathing problems, trigger asthma, reduce lung function and cause lung diseases. In Europe it is currently one of the air pollutants of most concern. Several European studies have reported that the daily mortality rises by 0.3% and that for heart diseases by 0.4 %, per 10 µg/m3 increase in ozone exposure.

Nitrogen Dioxide

Epidemiological studies have shown that symptoms of bronchitis in asthmatic children increase in association with long-term exposure to NO2. Reduced lung function growth is also linked to NO2 at concentrations currently measured (or observed) in cities of Europe and North America.

Sulfur Dioxide

SO2 can affect the respiratory system and the functions of the lungs, and causes irritation of the eyes. Inflammation of the respiratory tract causes coughing, mucus secretion, aggravation of asthma and chronic bronchitis and makes people more prone to infections of the respiratory tract. Hospital admissions for cardiac disease and mortality increase on days with higher SO2 levels. When SO2 combines with water, it forms sulfuric acid; this is the main component of acid rain which is a cause of deforestation.

The Weather Club

Friday, September 16th, 2011

The Weather Club, produced by the British Royal Meteorological Society “for a nation completely obsessed by weather”, looks at and explains the weather from an international perspective, works with kids, and provides a magazine scientists and weather nerds enjoy. Or just check out the gallery of beautiful photos.

Some recent articles:
2010: The year of extremes

Record highs
Record highs

[T]he trend in 2010 has been for record breaking highs, with several countries experiencing their highest ever temperatures: 49.6°C [121.3°F] in Dongola, Sudan (June); 52°C [125.6°F] in Basra, Iraq (June); 44°C [111°F] in Yashkul, Russia (July); 50.4°C [122.7°F] in Doha, Qatar (July); 37.2°C [99°F] in Joensuu, Finland (July) and 53.5°C [128.3°F] in Mohenjo-daro, Pakistan (June), the fourth highest temperature ever recorded. While we expect to see the odd record breaking high each year, this year has been unusual in that we’ve seen record after record broken.

National Oceanic and Atmospheric Administration (NOAA) figures show that the combined global land and ocean average surface temperature for March, April , May and June all reached their highest ever level this year. The June figure continued another trend by being the 304th consecutive month with a global temperature above the 20th century average.

Monsoon rains threaten flood disaster
Huge flooding in south Asia, millions affected, and I haven’t seen it covered in my news sources. Date: September 12, 2011

The recent flooding in southern Pakistan is threatening to spiral into another humanitarian disaster as the area prepares to be hit by more rain. Officials are now saying that more than 200 people have died and millions continue to be affected after two weeks of flooding in Pakistan’s southern Sindh region. Pakistan’s disaster management body told reporters that the situation is worsening every day as water levels continue to rise. The UN has begun relief work in the area but more rain has been forecast for the coming days.

Meanwhile, in India’s eastern Orissa state more than one million people have been displaced and 16 killed as floods sweep through the province. About 2,600 villages have been submerged across 19 districts. The army and navy have been called in to help, as many villagers are still stranded and dependent on food drops from helicopters.

After the 2010 Pakistani floods, the report was that climate change had not led to more rain each year in South Asia, but apparently, rain fell in more intense episodes, leading to more floods. I don’t know if this is still true.


Weather balloons used to probe wind farm effects

The project…hopes to improve the ability of the renewable energy industry to accurately forecast winds at the height of the turbine blades.

What caused the mini ice-age?

Hope and Climate Change

Tuesday, September 13th, 2011

We all know that hope is crucial to acting—if we’re doomed to failure, only a few of us bother. Yet, too frequent expressions of hope can have their down side. I remember when my aunt was dying, as she wasted away, she expressed her sense each time we met that she was getting better. I never felt like we got a chance to talk honestly.

Here are two examples that bother some about expressed hope. Then I want to hear what you have to say.

• I taught a workshop several times in which I gave people space to respond from their own personal experience, their own heart, about how they feel about climate change, right after showing slides on the facts of climate change, climate change to date, and predictions from scientists—mainstream to worst case—about what changes we could see this century. Go to Public Concern and Scientific Warnings Diverge for sample items on the prediction list (worst case).

Some spoke of grief or sadness, some of feeling a need for a beer. And twice in four years, young people (teens to 20) talked about hope. Once the hope was general, and one year more than one young person said they had hope because people their age would protest climate change and coal power, and so all would be well.

Both years, older adults complained to me about this sharing. One felt reprimanded for feeling grief, and all felt that expressions of hope felt so much like denial that it interfered with listening to and expressing their own feelings. Ultimately what I did is forbid people from expressing hope, likely the only such prohibition in the history of this exercise! People told me that they needed the prohibition to feel safe.

• People I know working on climate change sometimes say how much hope they feel. Eg, young people are taking such and such an action, which may be meaningless in itself, as a desire to respond to climate change. Recently someone became upset when I found little hope from this, instead I find hope when people listen, and respond after listening. I hear her example as people doing what they want to do, and hoping that it somehow addresses climate change. Hoping for a result doesn’t feel like hope to me.

So please help! How do you hear people expressing hope on climate change? What gives you hope on climate change?

Earthquake, Tsunami, and Nuclear Power in Japan: The Ocean of Light above the Ocean of Darkness

Monday, August 1st, 2011

My third article on nuclear power in Friends Journal, the August 2011 issue, Earthquake, Tsunami, and Nuclear Power in Japan: The Ocean of Light above the Ocean of Darkness, is now posted online. You can leave comments there (keep them polite) or here (polite definitely preferable).

Earlier Friends Journal articles:

The Nuclear Energy Debate Among Friends: Another Round July 2009
blog discussion
A Friend’s Path to Nuclear Power October 2008
blog discussion
• Unrelated: Addressing Hearing Loss Among Friends October 2003, Award of Excellence from Associated Church Press for being “The Most Personally Useful Article”

What do we want to pay for? Transportation is part of it

Sunday, July 31st, 2011

From the Miller Center, Well Within Reach, America’s New Transportation Agenda:

[S]ome 4 million miles of roads, 600,000 highway bridges, 117,000 miles of rail, 11,000 miles of transit lines, 19,000 airports, 300 ports, and 26,000 miles of commercially navigable waterways connect the country’s diverse and far-flung regions to each other and to an increasingly fluid and interdependent global marketplace.

But we aren’t funding transportation adequately.

This shortsightedness and underinvestment—at the planning level and on our nation’s roads, rails, airports and waterways—costs the country dearly. It compromises our productivity and ability to compete internationally; transportation users pay for the system’s inefficiencies in lost time, money and safety. Rural areas are cut off from economic opportunities and even urbanites suffer from inadequate public transportation options. Meanwhile, transportation-related pollution exacts a heavy toll on our environment and public health.

The Miller Center estimates that to bring road and other infrastructure maintenance (more for cars and trucks than for airplanes and trains) will cost $134 – $194 billion per year for more than 25 years to maintain highways, train and air transportation, and up to $264 billion/year to improve. This comes to the equivalent of $1-2/gallon of gasoline for the roads and bridges portion (though some or much of this money should come from weight and miles charges). The increases would be even greater if we shift some of the current funding methods so that vehicle use pays all the costs of infrastructure (currently, even the federal highway system is only 70% funded through gasoline tax, user fees, etc.

A $100/metric tonne cost for greenhouse gas emissions will add $0.90/gallon, and costs for greenhouse gas mitigation rise precipitously with failure to pay the costs today.

While a number of countries use taxes from gasoline for the general fund, much of it does go to paying for infrastructure. Here are a few examples of per gallon costs for gasoline elsewhere:

• UK $8.06
• Germany $8.37
• France $8.63
• Norway $9.84 (better to save the gasoline for export)

A number of countries have very high taxes on cars (in Denmark, registration plus VAT exceeds 200%).

We currently allow many to drive even when many know they are not good drivers, perhaps because they too often drive while under the influence, on the cell phone (it doesn’t matter what kind), distracted, angry, or tired. Per capita costs of US crashes are >$800. Congestion adds additional costs. There would perhaps be more money available for other needs if we begin with an assumption that I, and those I know, will not drive most our lives from age 16 to 106. Americans prize independence, and will find such a discussion a challenge. Yet our population is aging, and some would welcome a discussion of ways to lay down the burden of driving; others of all ages might prefer less social pressure to drive.

Cool sites for science teachers, parents, and human beings

Sunday, July 17th, 2011

evolution ladder
From Evolution site at UC, Berkeley

Climate Change

Science Prize for Online Resources in Education (SPORE) winners

Let me know about other sites, and information I should add to the descriptions. And enjoy!

Climate change from ppm to Nemo

Sunday, June 12th, 2011

Recent climate change posts from the American Association for the Advancement of Science site (plus one from International Energy Agency, and at the bottom, an unrelated post on bar-headed geese):

Climate Change Already Hurting Agriculture
Changes in agriculture due to climate change

With any number of factors influencing agricultural productivity, from changes in temperature and precipitation to newer technology and improved farming practices, not to mention year to year variations in weather, teasing out the climate effects is a challenge. The study focused on four foods supplying 75% of our calories (corn, rice, wheat, and soybeans) between 1980 and 2008, with changes in temperature more important than changes in precipitation.

Worldwide… yields of corn and wheat declined by 3.8% and 5.5%, respectively, compared with what they would have been without global warming. Rice and soybean production remained the same.

The US and Canada, where temperature increase was less, saw no decline in productivity.

drought
Meanwhile, Europe is now experiencing drought.

European drought
European drought—France, Europe’s largest food exporter, is getting less than half as much rain as 1971-2000 averages.

Drying Rockies Could Bring More Water Woes to Western U.S.

Snow pack is declining sharply. The big population push in Western states occurred at a time of higher-than-average (over the past few centuries) water availability, so even without climate change water availability would likely become a problem. 60 – 80% of drinking water comes from snow melt.

Losing Nemo?
clown fish
clown fish Visit National Geographic for information on 9 more species at risk

Clown fish use smell to avoid predators, but in an acidifying ocean this may not be possible. At 700 parts per million carbon dioxide, a level that may be reached by 2100, clown fish and damsel fish swim towards predators.

Mount Rainier Has Lost One-Seventh of Its Ice and Snow
The loss was between 1970 and 2008-9.

U.N. Goal of Limiting Global Warming Is Nearly Impossible, Researchers Say

A more advanced climate model run in Canada indicates that with a peak atmospheric level of 450 parts per million carbon dioxide in 2050, temperature increase would reach 2.3°C. This is difficult, and a 3 – 4°C goal is more achievable. To keep temperature increase to 2°C,

would require that greenhouse emissions “ramp down to zero immediately” and that scientists deploy means, starting in 2050, to actively remove greenhouse gases from the atmosphere.

Canadian climate model
Canadian climate model—we’re currently on the orange trajectory. Note that the different trajectories diverge around 2025, and depend on the decisions we make today (and those we made yesterday).

• Meanwhile, International Energy Agency says that the 450 ppm goal is very difficult. We’re at 390 ppm. Greenhouse gas emissions were 30.6 gigatonnes (billion metric tons = gt) in 2010. The goal of 450 ppm slips away if emissions reach 32 gt by 2020 (it’s cumulative emissions that matter, but a world building coal is unlikely to see a precipitous decline after 2020). 80% of power emissions for 2020 are already locked in, and coal construction is rapid.

In terms of fuels, 44% of the estimated CO2 emissions in 2010 came from coal, 36% from oil, and 20% from natural gas.

Coal expanded 46% in the first decade of the century.

Threats Sent to Australian Climate Scientists Fuel a Debate
Climate scientists in Australia receive threatening emails; some are moved for their safety. Shadow (opposition) science minister Sophie Mirabella implies this is no big deal and that the information was released to the newspaper for political reasons (Australia is discussing carbon tax).

Journal Retracts Disputed Network Analysis Paper on Climate
The paper by Edward Wegman, et al, attacking “poor statistical analyses” of mainstream climate scientists, was retracted because of plagiarism. Comments by scientists at the end focus on Wegman’s bad code, bad statistical parameters, and cherry picking the data, as well as his blaming the plagiarism on an anonymous student who was credited after the fact for the plagiarism, but not before as an author.

• Unrelated to climate change: The Most Extreme Migration on Earth?

bar-headed goose
bar-headed goose

The northbound geese typically made the trip from sea level over mountain passes of up to 6000 meters in just 7 or 8 hours at speeds of 64.5 kilometers per hour. They also logged the highest sustained climbing speed known from any bird species, of just under 1.1 vertical kilometers per hour. (Southbound geese do much less climbing because they start out high up on the Tibetan Plateau, so their trips took 4.5 hours or less.)

Most surprising was that the geese completed most of their journeys not during the day with the uplifting winds at their backs, but during the night or early morning, when headwinds were likely…

Cancer Rates and New Technologies for Treating Cancer

Saturday, May 21st, 2011

Even as cancer rates decline, changing demographics and treatments are expected to dramatically increase costs in the US by 2020. A public discussion will aid the public in determining priorities—absent this discussion, very expensive treatments will be used despite their poor record, just because that’s what doctors do when nothing else has worked for the patient in front of them.

Cancer rates

US cancer rates are changing, for a variety of reasons. From the March 25, 2011 Science, pp 1540-1 (subscription needed):

Lung and bronchus Lung cancer incidence began declining among men in the early 1980s and the death rate decline began in the early 1990s. Deaths for women continue to increase. Mortality rate overall decreasing. The death rate among African-American men is far higher than for white men. The trend lags changes in smoking habits. 2010 estimated deaths: 157,300

Colon and rectum Incidence per 100,000 peaked in mid-80s, while death rate has been declining since at least 1975. Improved diet and colonoscopies are helping; mortality may drop by half by 2020. 2010 estimated deaths: 51,370

Breast (female): Rate dramatically increased in the 1980s due to efforts to detect and treat invasive breast cancer, peaking in 1999 for all races. Death rates have been decreasing steadily since 1989-90. The survival rate is far higher for whites than African-Americans. 2010 estimated deaths: 39,840

Pancreas Incidence and mortality remain constant because detection is difficult. The average patient diagnosed with advanced disease lives only 6 months. 2010 estimated deaths: 36,800

Prostrate The incidence spiked in the early 1990s with the prostrate-specific antigen (PSA) screening test, although most tumors detected by this test are non-lethal. Death rate began declining about the same time. 2010 estimated deaths: 32,050

Leukemia Incidence has remained about constant, but death rates are slowly declining due to treatments combining chemotherapy drugs. Survival rate for childhood acute lymphoblastic leukemia is now 80%. 2010 estimated deaths: 21,840

Liver The incidence and mortality from liver and bile duct cancers have been rising steadily for decades, due to increases in hepatitis B and C and alcohol abuse. Tumors usually can’t be removed with surgery, so post-diagnosis survival is short. 2010 estimated deaths: 18,910

Brain (included because of concerns about cell phones; information comes from NCI surveillance program) Incidence increased through the late 1980s (because of increased testing?) Incidence began decreasing in the late 1980s and mortality in the early 1990s. Both incidence and mortality are much higher in whites than in African-Americans (greater testing? longer life expectancy since median age at diagnosis is 56?) 2010 estimated deaths: 13,000

Treatment Costs

Can Treatment Costs Be Tamed? (March 25, 2011 Science, subscription needed) addresses the costs of cancer treatment which are increasing much faster than the population.

Over the past 3 decades, total U.S. spending on cancer care has more than quadrupled, reaching $125 billion last year, or 5% of the nation’s medical bill, according to a recent estimate. By 2020, it could grow by as much as 66%, to $207 billion. Multiple forces are driving the spiral: a growing and aging population, more people living longer with cancer, and new “personalized,” or “targeted,” therapies that can come with sticker-shock prices of $50,000 or more per patient.

Outpatient treatments are helping costs per patient decline, but these savings are swamped by the increasing number of older people, more likely to get cancer. Medicare predicts that its rolls will almost double from by 2020, from 40 million to 70 million. If all other costs stay the same, demographic changes will increase national cancer costs by 27%.

Increasing survival rates also pushes up cancer rates: the number receiving “continuing care” for breast and prostrate cancer are expected to increase 41% by 2020, adding $18 billion.

Targeted therapies may be important for society to address. Personalized therapies can be expensive, but some only extend life for a few weeks or months. One treatment for lung cancer extends life a year at a cost of more than $1.2 million. Drug costs are currently less than 15% of treatment costs, but new, costly drugs may increase their share.

Some argue that drugs that cost more/”quality-adjusted life year” than dialysis ($129,090, which would make the US still more generous than the United Kingdom, Canada, and Australia) should not be funded by Medicare and insurance, and shouldn’t be funded off-label (for cancers other than originally approved). Others argue that preventing off-label use would

hobble the proven practice of freeing doctors to find promising new uses for existing drugs. And it would stand “in stark contrast with clinical practice.” Studies, for instance, suggest that up to 75% of anticancer drugs are already used off-label. And price controls would, they argue, ultimately cause investors to reduce funding for research into new drugs because they couldn’t be sure of recouping their costs.

Both sides agree on the need for better, more organized studies.

One idea gaining favor is the idea that insurance companies would provide “coverage with evidence development”, provide coverage in order to get the data to compare effectiveness, with the aim of discontinuing coverage if drugs don’t work. “Risk-sharing arrangements” between insurers and manufacturers could link drug prices to performance.

Other topics (subscription needed):
Celebrating an Anniversary
Video: Sequencing Cancer Genomes–Targeted Cancer Therapies
Cancer Research and the $90 Billion Metaphor with Infographic (cancer information on rates)
40 Years of the War on Cancer
Combining Target Drugs to Stop Resistant Tumors
Can Treatment Costs Be Tamed?
A Push to Fight Cancer in the Developing World

Making Her Life an Open Book to Promote Expanded Care
Brothers in Arms Against Cancer (siblings of p53, the tumor-blocking protein)
Exploring the Genomes of Cancer Cells: Progress and Promise
A Perspective on Cancer Cell Metastasis
Cancer Immunoediting: Integrating Immunity’s Roles in Cancer Suppression and Promotion

Did Wedges Help Clarify the Path Forward?

Thursday, May 19th, 2011

In 2004, Robert Socolow and Stephen Pacala published an article in Science, (subscription needed) introducing the wedge: over 50 years, the savings from currently available technology could be ramped up to save 1 billion metric tons of greenhouse gases in the last year, saving in total 25 billion metric tonnes of carbon-equivalent (or 92 metric tonnes of carbon dioxide equivalent). Using optimistic assumptions about the rate of GHG growth, they calculated that 7 wedges could stabilize GHG by 2055. Of course, more sources of GHG reduction were needed to reduce GHG emissions.

Pictures help.
Socolow Wedge
Socolow Wedge

The authors emphasize paying attention to the big numbers first, the technologies that could lead to 1 billion metric tonnes of reduction in year 50.

The disadvantages in the wedge concept were in how their ideas were received. One was the appeal to so many of solving climate change with only 7 wedges (with perhaps some more to bring reductions down), the appeal of solving climate change with existing technologies, the appeal of getting to choose which solutions we want over the expert community’s more prosaic hopes that there would be enough solutions.

As of the September 10, 2010 Science, Farewell to Fossil Fuels? (subscription required), the estimate is now 25. Socolow and Pacala never said 7 wedges were enough, but the small number did make finding solutions look easier.

Socolow and Pacala encouraged this with the Stabilization Game, giving all of us a chance to vote for what we want, and vote against what we don’t want. Eventually, I rejected the wedge concept as a teaching tool because it was being abused by so many for all those reasons.

Update: It was not an interview. Socolow has posted comments, including more optimistic assumptions than I see elsewhere on the number of wedges needed.

Robert Socolow has reached the same conclusion. In a National Geographic interviewsummary of a Socolow talk, he now says the wedge concept was a mistake:

“With some help from wedges, the world decided that dealing with global warming wasn’t impossible, so it must be easy,” Socolow says. “There was a whole lot of simplification, that this is no big deal.” …[I]nstead of providing motivation, the wedges theory let people relax in the face of enormous challenges, he now says.

“The job went from impossible to easy” in part because of the wedges theory. “I was part of that.”

And from there, he says, a disturbing portion of the population moved to doubt that the problem is even real…

“The intensity of belief that renewables and conservation would do the job approached religious,” Socolow said. But the minimum goals “are not enough,” he said, and “the fossil fuel industry will not be pushed over.”

Who was most likely to abuse the web concept?

Henry Lee, who directs the environment program at the Harvard Kennedy School’s Belfer Center for Science and International Affairs, said many people were optimistic that, by now, the world would be making considerable progress on climate.

“I think we were victimized more by the advocacy community than by science,” Lee said. Using Socolow’s wedges theory and similar arguments, advocates suggested “you could get all of this and pay nothing. I think people feel angry now, that it’s going to cost them.”

Lee agreed Socolow’s ideas were misused, or at least misread. “If you look at the wedges they weren’t a little. There was nothing in the Socolow plan that says this is a slam-dunk and easy to do.”

“The wedge theory still is valuable,” Lee added. “The price tag may be higher, but I think he made an important contribution. If you’re going to do something about climate change, there is not one silver bullet. That’s the point he made at the time, and it’s still valid.”

Hopefully, we can still use some of what they taught (focus on the large, the solutions are silver buckshot). Hopefully we can find ways to help the advocacy community understand that we don’t have so many solutions that we can reject any.

IPCC: Special Report Renewable Energy Sources

Wednesday, May 11th, 2011

Intergovernmental Panel on Climate Change’s new report, Special Report Renewable Energy Sources (SRREN), is due out soon. The summary for policymakers (pdf) is available now.

The questions this report addresses are important: how much electricity and other energy can be supplied by renewables? At what cost? This report (more so the full report and technical summary) will help us make sense of conflicting claims today. All policy experts agree that renewables are needed, along with other low-carbon forms of energy, but what is their potential in the coming decades?

How much energy comes from renewables today?
Currently, world primary energy is 492 exajoules (the joule is the metric unit of energy. 1 exajoule = 10^18 joules = 1 billion billion joules = 278 terawatt hours (trillion watt hours or billion kWh).

Renewables supply 12.9% of this energy, of which 60% is traditional biomass, eg, wood, used for cooking and heating. 10.2% of all energy, 80% of all renewables, is biomass of some kind. Of the remaining 2.7%, 2.3% is hydro, 0.4% is other.

The graphs are a little confusing; energy sources are placed on different graphs because there is so much more of some than others. Recent gains in solar are impressive—photovoltaics, solar panels are up by almost a factor of 10 in 4 years, but the absolutely increase in exajoules pales compared to increases in other forms of renewables, from hydro to municipal solid waste. Also, information is often given in capacity, or GW—capacity tells us how much power is produced, at a maximum—rather than in GWh, total energy produced. [For example, German photovoltaics, with their 9.5% capacity factor, produce half as much electricity per GW as do PV in California, where the capacity factor is twice as large. Wind generally does better, but German wind has a capacity factor of less than 20%, while American wind is more than 30%. (To compare, American nuclear power capacity factor is >90%). So 1 GW of German solar produces half as much electricity as 1 GW of CA solar or German wind, and less than 1/3 as much as US wind.]

Most renewables except hydro and geothermal are more expensive than non-renewables. The costs of many are expected to decline.

How much energy can come from renewables by 2030? 2050?
The full report examines 164 scenarios. The use of renewables increases under all scenarios, no surprise. In the most ambitious scenario, renewables supply up to 43% of energy in 2030 and 77% in 2050. Half of scenarios show a contribution of >17% in 2030 and >27% in 2050.

Bioenergy appears to supply half or more of renewables in both Annex I and non-Annex I countries. Here are the median (half are higher, half are lower) estimates for 5 types of renewables (Annex 1/non-Annex 1), read from the graphs:
• bioenergy: 30 EJ/70 EJ
• hydro: 10 EJ/15 EJ
• wind: 10 EJ/15 EJ
• solar: 8 EJ/12 EJ
• geothermal: small
Marine energy is thought to be relatively unimportant in 2050.

The highest estimates assume a combined 430 EJ/year, considerably more than the median. Bioenergy, solar, and wind are much higher than the median in some scenarios.

The cost, depending on how ambitious the goal, would be $1.4 – 5.1 trillion between now and 2020, and $1.5 – 7.2 trillion between 2021 and 2030. For some renewables, there would be savings later because fuel costs are less. Costs of the renewables themselves are uncertain, and there are additional costs:

The costs associated with RE integration, whether for electricity, heating, cooling, gaseous or liquid fuels, are contextual, site-specific and generally difficult to determine. They may include additional costs for network infrastructure investment, system operation and losses, and other adjustments to the existing energy supply systems as needed. The available literature on integration costs is sparse and estimates are often lacking or vary widely.

So costs depend. Also, maintaining system reliability will become more difficult, but having a portfolio of renewables reduces risks and costs of grid integration.

What might interfere with some of the more ambitious plans?
First, hydro and bioenergy availability is less certain in the future:

Climate change will have impacts on the size and geographic distribution of the technical potential for RE [renewable energy] sources, but research into the magnitude of these possible effects is nascent…Because RE sources are, in many cases, dependent on the climate, global climate change will affect the RE resource base, though the precise nature and magnitude of these impacts is uncertain. The future technical potential for bioenergy could be influenced by climate change through impacts on biomass production such as altered soil conditions, precipitation, crop productivity and other factors. The overall impact of a global mean temperature change of below 2°C on the technical potential of bioenergy is expected to be relatively small on a global basis. However, considerable regional differences could be expected and uncertainties are larger and more difficult to assess compared to other RE options due to the large number of feedback mechanisms involved. For solar energy, though climate change is expected to influence the distribution and variability of cloud cover, the impact of these changes on overall technical potential is expected to be small. For hydropower the overall impacts on the global potential is expected to be slightly positive. However, results also indicate the possibility of substantial variations across regions and even within countries. Research to date suggests that climate change is not expected to greatly impact the global technical potential for wind energy development but changes in the regional distribution of the wind energy resource may be expected. Climate change is not anticipated to have significant impacts on the size or geographic distribution of geothermal or ocean energy resources.

[The following were not mentioned in the SPM, though they may be included in the main report:
• A study just published in Science says that the climate already may be affecting worldwide wheat and maize (corn) production.
• There is a likely link between hydro and the Sichuan earthquake which killed 70,000. Worries about earthquakes could reduce the addition of hydro.
MIT analysis suggests wind turbines could cause temperatures to rise.]

The report emphasizes that the potential for renewable energy is large. However,

Factors such as sustainability concerns, public acceptance, system integration and infrastructure constraints, or economic factors may …limit deployment of renewable energy technologies.

There are some steps between here and there:

A variety of technology-specific challenges (in addition to cost) may need to be addressed to enable RE to significantly upscale its contribution to reducing GHG emissions. For the increased and sustainable use of bioenergy, proper design, implementation and monitoring of sustainability frameworks can minimize negative impacts and maximize benefits with regard to social, economic and environmental issues. For solar energy, regulatory and institutional barriers can impede deployment, as can integration and transmission issues. For geothermal energy, an important challenge would be to prove that enhanced geothermal systems (EGS) can be deployed economically, sustainably and widely. New hydropower projects can have ecological and social impacts that are very site specific, and increased deployment may require improved sustainability assessment tools, and regional and multi-party collaborations to address energy and water needs. The deployment of ocean energy could benefit from testing centres for demonstration projects, and from dedicated policies and regulations that encourage early deployment. For wind energy, technical and institutional solutions to transmission constraints and operational integration concerns may be especially important, as might public acceptance issues relating primarily to landscape impacts.

There can be challenges integrating the renewables into the grid.

The characteristics of different RE sources can influence the scale of the integration challenge. Some RE resources are widely distributed geographically. Others, such as large scale hydropower, can be more centralized but have integration options constrained by geographic location. Some RE resources are variable with limited predictability. Some have lower physical energy densities and different technical specifications from fossil fuels. Such characteristics can constrain ease of integration and invoke additional system costs particularly when reaching higher shares of RE.

Water availability could affect hydropower, bioenergy, and thermal plants (such as solar thermal or biomass).

Modeling GHG emissions from biomass is particularly difficult because of land use change. In order to grow plants for electricity or fuel, the land is converted from another use (such as forest).

And it could be even better
Potentially, the use of biopower with carbon capture and storage may reduce atmospheric carbon. This is because plants take carbon dioxide out of the air, and release it back when burned to make electricity or fuel. CCS could be used when making electricity, so that the carbon dioxide goes into long-term storage.

By 2050, renewables may be more attractive than other low-GHG forms of energy, such as nuclear or carbon capture and storage.

Many combinations of low-carbon energy supply options and energy efficiency improvements can contribute to given low GHG concentration levels, with RE becoming the dominant low-carbon energy supply option by 2050 in the majority of scenarios.

[Note: more will be known in a decade or three on the costs of the various renewable technologies, as well as the costs of nuclear and carbon capture and storage. And more will be known about the pitfalls of all technologies.]

This report is a welcome addition to IPCC policy analysis.

Monbiot and Caldicott

Thursday, March 31st, 2011

Update: Monbiot finally reads the sources Caldicott recommends, and learns that she quotes unreliable sources and misquotes the reliable ones. Monbiot also links to the Guardian environmental editor who is upset to be put in the science-denial camp, and confirms his position there by warning that “Fukushima’s meltdown may be worse” than Chernobyl and accusing World Health Organization of being part of the Chernobyl cover up.

Monbiot:

Over the last fortnight I’ve made a deeply troubling discovery. The anti-nuclear movement to which I once belonged has misled the world about the impacts of radiation on human health. The claims we have made are ungrounded in science, unsupportable when challenged, and wildly wrong. We have done other people, and ourselves, a terrible disservice.

Monbiot debates Caldicott on Democracy Now.


Transcript

I’m assuming that anyone debating Caldicott has to enter in a very centered space, because she is not one to allow people to finish a sentence where she clearly sees mistakes, and Goodman is not very effective at explaining whose turn it is to speak.

I too find Caldicott’s claim of UN conspiracies to cover up claims that 1 million are already dead from Chernobyl somewhat unlikely, and am interested that a physician seems unaware that most cancers take years to develop. The International Atomic Energy Agency’s Chernobyl Report (pdf), the report accepted as scientific consensus (which means that disagreement from scientists would have appeared in Science and Nature) says there are 50 – 60 dead from Chernobyl, thousands of cancers attributed to the accident (both are true: juvenile thyroid cancer has close to 0 death rate), and more than 4000 deaths may occur in the next 5-6 decades. There are differences between the IAEA assumptions and the greater numbers produced by Caldicott, Greenpeace (pdf), etc.:
• scientists assume that most cancers take years to develop—leukemia and juvenile thyroid cancer are exceptions.
• scientists assume that pre-Chernobyl data in the Ukraine and surrounding areas are unreliable.
• scientists look at a number of explanations for increased mortality.
• scientists find a cause more likely if increased exposure is associated with increased mortality and morbidity.
• scientists compare the results for other known exposures. For example, according to Radiation Effects Research Foundation , there was not a statistically discernible change in birth defects in Hiroshima/Nagasaki (except for women pregnant at the time of the bombings, and this does not appear to have been passed on to succeeding generations).

Here are recent health data from Ukraine. In line with much of the rest of the Soviet Union, the life expectancy of males is very low. Ukraine ranks third in the world in deaths from poisonings (including alcohol?) and heart disease (heart disease is the most important cause of death associated with drinking and smoking, but it’s also the second most important cause of death worldwide, after lower respiratory infections), and 19th for liver disease. Ukrainians rank 5th worldwide in alcohol consumption; data for smoking are not available. Not so high for cancers, HIV/AIDS, or car accidents. Congenital anomalies are high, but alcohol-related birth defects are high there. Men are especially at risk: the male: female ratio goes from 0.92 for ages 15 – 64 to 0.5 for ages 65+. Literacy is high.

Russia shows a similar pattern. Russia ranks 6th worldwide for alcohol consumption and 1st in cigarette smoking. Men die even younger, compared to women, in Russia than in Ukraine. Literacy is high.

From a Wikipedia article, Long-term effects of alcohol:

High levels of alcohol consumption are correlated with an increased risk of developing alcoholism, cardiovascular disease, malabsorption, chronic pancreatitis, alcoholic liver disease, and cancer. Damage to the central nervous system and peripheral nervous system can occur from sustained alcohol consumption. Long-term use of alcohol in excessive quantities is capable of damaging nearly every organ and system in the body. The developing adolescent brain is particularly vulnerable to the toxic effects of alcohol.

Also accidents, as well as car and pedestrian accidents in countries with significant numbers of cars.

Note: both Monbiot and Caldicott make mistakes; however, I especially wonder at Caldicott’s assumption that as a physician, she never makes mistakes. I know people who turned agnostic on nuclear power on January 1, 2000 after hearing Caldicott warn that Y2k would lead to nuclear power plants meltdown.

Update: Brief bios for Monbiot and Caldicott
Helen Caldicott was a doctor until 1980, when she quit medicine to oppose nuclear power and nuclear weapons. She detours into other subjects:

Caldicott’s investigative writings had the distinction of being nominated and subsequently chosen as Project Censored’s #2 story in 1990. Citing the research of Soviet scientists Valery Burdakov and Vyacheslav Fiin, Caldicott argued that NASA’s Space Shuttle program was destroying the Earth’s ozone and that 300 total shuttle flights would be enough to “completely destroy the Earth’s protective ozone shield,” although there is no scientific evidence to back up this claim.

Among anti-nuclear power people I know, Caldicott is the best known activist, and the least respected.

George Monbiot is an environmental and political activist who writes regularly for The Guardian. His Wikipedia biography contains much that is new to me about his travels,

His activities led to his being made persona non grata in several countries and being sentenced to life imprisonment in absentia in Indonesia. In these places, he was also shot at, beaten up by military police, shipwrecked and stung into a poisoned coma by hornets

and his politics (offering a reward to anyone who attempts a citizen’s arrest of former prime minister Tony Blair).

Monbiot began as anti-nuclear, shifted to neutral over the years because of his concern on climate change, and has recently declared himself in favor of nuclear power:

You will not be surprised to hear that the events in Japan have changed my view of nuclear power. You will be surprised to hear how they have changed it. As a result of the disaster at Fukushima, I am no longer nuclear-neutral. I now support the technology.

A crappy old plant with inadequate safety features was hit by a monster earthquake and a vast tsunami. The electricity supply failed, knocking out the cooling system. The reactors began to explode and melt down. The disaster exposed a familiar legacy of poor design and corner-cutting. Yet, as far as we know, no one has yet received a lethal dose of radiation.

Contrails are dangerous—they warm the Earth

Tuesday, March 29th, 2011

Contrails
Contrails contribute to climate change by interfering with long wave (infrared) radiation escape into space. Contrail coverage can reach 6% in eastern North America, and up to 10% in central Europe.

In a 1999 report, Aviation and the Global Atmosphere, Intergovernmental Panel on Climate Change suggests that the net effect of flying on climate change would be 2 – 4 times that from the carbon dioxide emissions alone. One of the larger contributors was the addition of water vapor high enough in the atmosphere that quick turnover could not occur. The effects of nitrogen oxides and aerosols was also important. Uncertainties were enormous.

Now a new analysis suggests that the average contribution of contrails is 31 milliWatts (1 mW = 0.001 W) per square meter, compared to 28 mW for the total contribution of CO2 from airplanes from the beginning of the jet age.

The original article, Global radiative forcing from contrail cirrus, has added information and some figures.

Neither article suggests if the estimates on aerosols or nitrogen oxides has changed. The IPCC report suggests that there is little net effect from aerosols, as black carbon aerosols and sulfate aerosols produce effects of similar magnitude but opposite sign.

Context: The 1997 IPCC Report from Working Group 1 gives a total radiative forcing of 1.6 W/m2 (big error bars). Forcings are human changes that change the net radiation balance of the Earth, and include positive forcings such as carbon dioxide, methane, ground layer ozone, and black carbon on snow, and negative forcings such as land use change (deserts reflect better than forests) and destruction of stratospheric ozone.

The contributions of flying to date from contrails and carbon dioxide add 59 mW/m2, or about 4% of net forcings*.

* Sometimes people compare to net forcings, sometimes to positive forcings or the largest positive forcing, carbon dioxide.

Daiichi reactors—there are still concerns

Monday, March 28th, 2011

Before and after tsunami
Before and after tsunami, north of Sendai

While the likelihood remains high that the dire warnings of “experts” such as Michio Kaku and Nancy Grace won’t be realized, the other expert community (those who are knowledgeable) is not breathing a sigh of relief. At this point, the situation at the Daiichi reactors is more stable than a few days ago; however, International Atomic Energy Agency says, “The situation at the Fukushima Daiichi plant is still very serious.” You can see current news at the IAEA facebook page or web site. American Nuclear Society does a twice-daily summary. Atomic Power Review provides clear frequent updates. As I write this post, new information keeps popping up, often followed by “oops”; rapid information is not always accurate information.

At this time, many feel the most important energy issue in Japan is insufficient gasoline, heating fuel, and electricity.

Before and after the tsunami

The situation in Daiichi will be considered serious until cold shutdown is achieved for all 6 units. The World Nuclear Association, in discussing the Daini reactors, describes cold shutdown: “coolant water is at less than 100ºC [212°F]- with full operation of cooling systems”. Units 5 and 6 are in cold shutdown, according to IAEA. Units 4 – 6 were down for maintenance when the earthquake occurred, but their fuel rods need to be covered by water for some time, because the smaller fission products continue to decay and generate heat. Sources I have read predict cold shutdown will take days to months to complete.

Biggest concern Monday PM, PDT

The largest challenge today is the significant radioactivity in the water, especially around Reactor 2. Nineteen workers have now received doses greater than 100 millisievert, although below the 250 mSv dose allowed for emergencies. See bottom of this post for a discussion of units, regulatory limits, and safety.

Radioactivity measurements fluctuate rapidly, and differ widely by location.

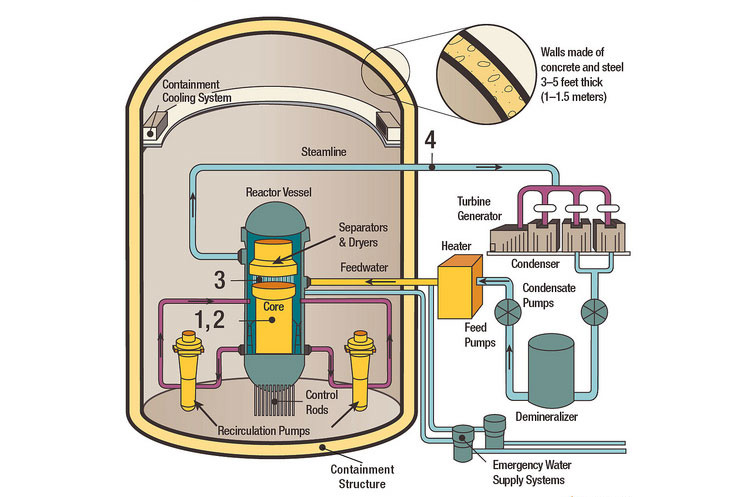
Boiling Water Reactor

Where is the radioactivity coming from? is the question of the hour. There appears to be no major breach in the reactor walls since pressure remains high. The current best guess is leakage from the pipes between the reactor and turbine, the primary reactor loop, based on isotopic composition (actual atoms present). High levels of radioactivity in the turbine buildings (highest for reactor 2) may be coming from damaged fuel rods. Meanwhile, it is clear that diagnosis and repair are slowed by the presence of high radioactivity.

Scary numbers indicating the possible spread of radioactivity to the public (Japan Soil Measurements Surprisingly High) are hard for us in the public to sort through. As a non-expert, I cannot weigh in as to which of several possibilities (eg, surprise that this amount can be/would have been spread, or suspicions about incorrect data) is more likely. (More on the implications of one set of soil measurements, although no one, so far as I know, has confirmed the numbers.) I would be uncomfortable opting for or excluding particular options at this point.

Safety culture/journalism culture
The current analysis, which may differ from the best understanding in a few months, report several failures among the Japanese to respond to warnings about tsunamis, etc. The international community plans to discuss a variety of safety concerns. For example, the Japanese use a deterministic model, going back through hundreds of years of data to ascertain worst-case conditions that a reactor might see, while Americans use probabilistic models which result in more stringent designs. Numerous concerns have been shared by a world sympathetic to the reality that Japan has other issues on its plate right now, and the many Tepco employees carrying the burden of friends and family dead and homeless, but contradictory and insufficient information interferes with communication. Tepco perhaps should have appointed a person immediately to explain clearly what was and was not known about the state of the Daiichi plants.

Criticism of media coverage is beginning as well. Fiona Fox of BBC describes journalists who assume that those who know what they are talking about operate from bias, and so rely on the other kind of experts, those who don’t know what they are talking about. A substantial percentage of media were culpable, and we can hope that there will be meaningful media investigations, and perhaps a reconsideration of media culture.

The US has come in for criticism as well—the decision to set an 80 km evacuation zone for Americans when Japan had a 20 km zone necessarily implies that Japanese understanding is inadequate, or inadequately communicated. The one particular concern cited by Nuclear Regulatory Commission Chair Gregory Jaczko, indicating a problem with the water level in reactor 4, turned out to be incorrect, and there is worry that the evacuation decision may have been made by people insufficiently “sure of their facts”.

Putting the Danger into Perspective
The Daiichi reactors contain enormous amounts of radioactivity, more than was in the one Chernobyl reactor. Few of us have more than a basic understanding of how that radioactivity will enter the environment, or be prevented from doing so. For many of us, the problems at Daiichi fit into their “what ifs” about nuclear power, one of many scenarios just waiting to happen. (Dr. Robert DuPont, who specializes in phobias and anxieties, became interested in nuclear power after seeing media coverage for over 10 years focus on “what ifs” rather than actual reports of harm.) Still others believe that the media would not make statements in gajillion font ALL CAPS plenty of !!! without reason. (After seeing media coverage of the Scott Peterson arrest, I no longer share this belief.) The focus on the nuclear dangers at Daiichi has crowded a number of arguably as or more important topics off the front page.

So far, almost 11,000 are known dead from the earthquakes and tsunamis, and the number of missing is at above 17,000. About 200,000 remain in shelters and refugee centers.

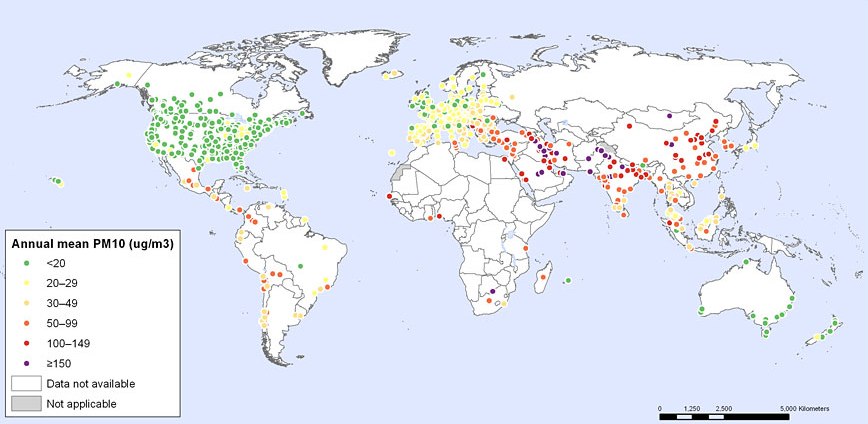
As I write this, it is 2.5 weeks since the earthquake. World Health Organization estimates that 150,000 people die worldwide from air pollution in an average 2.5-week period, and that 5,000 (pdf) died from climate change in 2000 (and perhaps more this year). To be fair, it is unreasonable to hope that the media ever devote in a year the amount of coverage to these kinds of problems as it has for the past 2.5 weeks to Daiichi.

People who could be experts—it’s hard to sort out
As always happens, there are a number of sources in the middle of a continuum that begins with Kaku and Grace at one end and continues to IAEA at the other. Two sites have been brought to my attention: New Scientist reports Fukushima radioactive fallout nears Chernobyl levels quoting Gerhard Wotawa of Austria’s Central Institute for Meteorology and Geodynamics in Vienna. Union of Concerned Scientists begin a press conference with a claim that they neither oppose nor support nuclear power, a claim unlikely to be accepted by either supporter or detractor. They then cite the same source.

At this time, estimates of the total radiation released are likely to suffer from insufficient and selective choice of data, and sometimes inaccurate data among the flood of information. The UCS warning that the total release could be several times worse than Chernobyl is especially dubious. Since UCS has a history of sensationalizing the ordinary, I personally prefer to avoid the whole process of double-checking their data and ideas, and begin with sources less prone to error.

Why the bet is still against another Chernobyl despite some numbers and comments online
The general belief remains that neither the exposure nor the health consequences will come close to that produced by Chernobyl (see IAEA’s The Chernobyl Report (pdf)). The cumulative size of the reactors at Daiichi is greater than the Chernobyl (1000 MW). However, Chernobyl was on, creating fission products, when the accident occurred. Of the six Daiichi reactors, half were off in cold shutdown when the earthquake occurred, and the others went off immediately. Fission products are still being produced, but at a much lower rate (hence the need for boron and water to absorb extra neutrons). About 3/4 of radioactivity released at Chernobyl came from xenon-133, with a 5.2 day half life. More than 3 half-lives have passed since the earthquake, so the store of xenon is down to less than 1/8 of its original levels (the daughter cesium-133 is stable). Iodine-131 was the second most important isotope, responsible for more than 90% of the remaining radioactivity. More than 2 of its half-lives (8 days) have passed, so iodine levels are down below 1/4 of the original store (the daughter xenon-131 is stable). The next 4 on the list—cesium-137, cesium-134, krypton-85, and strontium-90—were responsible for about 2% of the radioactive release at Chernobyl; their half-lives are too long for much decay to have occurred since the earthquake. (Chernobyl release from table 15.2 in David Bodansky, Nuclear Energy, 2nd Edition)

Second, there is a containment system. If sufficiently stressed, it may fail, but a sizable portion of the radioactivity will still be contained. Third, burning graphite facilitated the spread of radioactivity at Chernobyl, and no such mechanism exists in Western reactors. Fourth, the effects of Chernobyl were exacerbated by uneven distribution of potassium iodide, and inadequate restrictions on milk and other foods in the affected areas.

The worse than worst case is this: 50 – 60 dead since Chernobyl, primarily immediate deaths among the firemen (31 dead within months) and juvenile thyroid cancer (15). There have been thousands of thyroid cancer to date, and there may be 4,000 more deaths from the initial exposures to radioactivity over the next few decades. Pretty horrible. At this point, the expectation is that Daiichi will not come close to being that dangerous.

Economically, the cost is likely to be high. Three reactors are ruined, and will need to be replaced at a time when Japan has a shortage of electricity. If there is substantial leakage of radioactivity, remediation of some land may be necessary. Overly rigorous regulatory standards for safe levels of radioactivity may result in throwing away food with low levels of danger.

Not as bad as Chernobyl, but Daiichi could still produce deaths and enormous costs, and the situation is far from resolved.

Explaining units, an introduction
The most frequently used unit for dose is sievert, Sv. Unfortunately the US, per usual, has a completely different set of units, but fortunately the conversion is easy: 1 Sv = 100 rem. Milli and micro indicate 1/1000 and 1/1,000,000. Unfortunately, there are other units used by the media, such as curie, becquerel (Bq, decays per second), and from Geiger counters, counts per minute. For a more complete look at units, see Measuring Radiation. The sievert is not quite decay rate, rather it is decay rate is multiplied by a scaling factor between 1 (X-rays, gamma rays, and electrons—beta particles) and 20 (alpha particles and fission fragments) to reflect the degree of actual damage. There are about 9,000 hours in a year, so multiply dose per hour by 9,000 to get a sense of magnitude. Readers will welcome any explanation that makes sense of Bq/square meter and “times normal” as many of us don’t know what normal is.
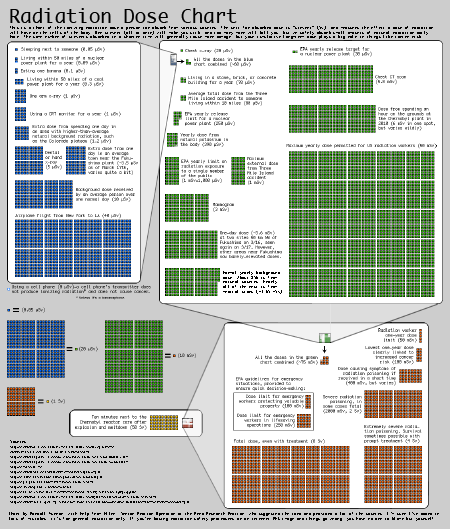
Radiation chart
Radiation chart
Click to view in full

How much is safe? Officially, there is no safe level. Typical American background is 3 mSv/year, and Americans are exposed to another 3 mSv/year from medical procedures (although this may be an underestimate (Science subscription needed)). Yet we do not receive travel advisories when we visit Denver (>2 times US average), let alone parts of India, Norway and Brazil where background levels might be >35 times the US average, or Ramsar, Iran, a resort where background radioactivity is about 100 times the US average.

Dose rate matters. For a large dose in a short time, the powers that be (eg, National Academies Biological Effects of Ionizing Radiation) deem risk coefficients at 0.08/sievert for workers and 0.1/sievert for the general population, which includes children and older people. So for every sievert exposure to a group from the general population, 0.1 death will result. When dose or dose rate is smaller, many groups recommend dividing this risk coefficient by 2. According to the Linear No Threshold model, 1 person receiving a 10 Sv exposure will die. One person out of 10 each receiving a 1 Sv exposure will die. One person out of 100 receiving a 0.1 Sv exposure will die. Between 0.5 and 1 person out of 10 million each receiving a 1 microSv exposure will die.

Regulatory standards can be set at very different safety levels. For radioactivity, the risk at the level regulated appears to be low.

From the Japanese prime minister’s office:

Japan’s provisional standard values for the radioactive levels of agricultural products including vegetables have been set based on the standard values established under the International Commission on Radiological Protection (ICRP). The provisional standard values are precautionary measures. Even if a person continues to intake the radioactive levels exceeding the Japanese provisional standard values for one year, it would not pose risks to the health.

This is not always true: the US standard for drinking water was 50 micrograms/liter, leading to 1 out of every 1000 people developing bladder cancer. (This is now 10 microgram/liter to lower danger below 1 in 10,000. The problem is greater where ground water is used, and in the West.)

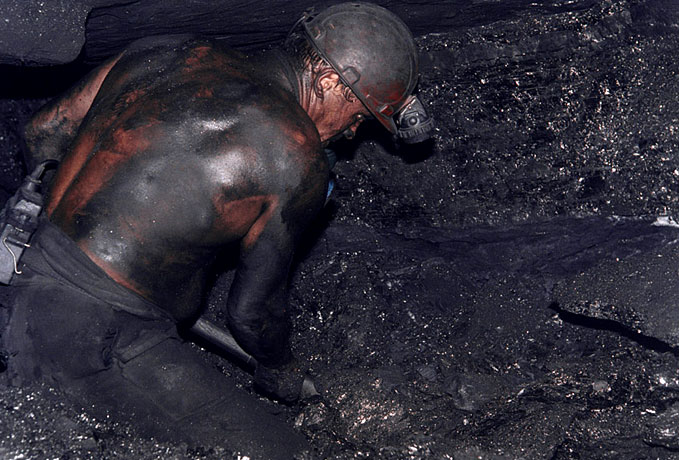
March 16, two weeks ago, Environmental Protection Agency (pdf) proposed rules that will not eliminate the effect of coal on human health, but would help, by preventing “up to 17,000 premature deaths, 11,000 heart attacks, 120,000 asthma attacks, 12,200 hospital and emergency room visits, 4,500 cases of chronic bronchitis, and 5.1 million restricted activity days.”

It’s not over
One advantage that the coal industry has in explaining many of its tragedies is that they tend to be over fairly soon, and are often easier to explain.

We can only hope that the various challenges facing the Japanese—cold, homelessness, fear, and Daiichi—are over soon. Dealing with all the challenges, though, may require a long wait. Across Japan, and at Daiichi, it is likely to take a while to understand the full extent of the damage.

Note: I am a lay person. Corrections welcome!
Update: decay chain daughters added, added link to Atomic Power Review, added comment from Japanese prime minister’s office

Japan challenged

Monday, March 14th, 2011

The Al Jazeera blog is providing more details than I’ve seen elsewhere on what is happening in Japan.

Their video on Rikuzentakata where 18,000 out of 24,000 residents are missing.

Do you have recommended sources?

Japanese earthquake and tsunamis, March 2011

Sunday, March 13th, 2011

I’ve experienced two large earthquakes, in Los Angeles and the SF Bay Area, but I have no context for the destruction wrought by the recent 8.9 earthquake in Japan. I add my prayers to those of the rest of the world, and admiration for the education and attention ahead of time, and response since.

These satellite pictures provide a powerful introduction to the scale of the disaster.

Eg,
after and before
after and before pictures from NY Times

For now, the concern of most people outside Japan seems to have shifted away from direct damage and suffering, and many are focused on the challenge of cooling down nuclear power plants without power for the pumps.

Sources I am using:

World Nuclear Association, updated several times during the day with what is going on at which nuclear power plants, how many have died (one worker known dead at time of posting), etc.

Update
: World Nuclear News now has new posts, including Contamination checks on evacuated residents and Efforts to manage Fukushima Daiichi 3.

American Nuclear Society at their blog provides links to official sources, as well as articles reposted from a number of sources, particularly NY Times and Reuters, and links to other coverage. Keep in mind that headlines may not describe the story accurately. I just linked to Japan tries to avert nuclear meltdown; 10,000 may be killed, about tsunami concerns.

The most recent articles posted include one from Platts, with quotes from Dale Klein, previous chair of US Nuclear Regulatory Commission, and one from Reuters, interviewing Robert Engel, a “nuclear German industry expert”.

We will know more soon, and much more in the months ahead, but this is similar to what I have been reading from others who are knowledgeable:

Reuters:

Robert Engel, a structural analyst and senior engineer at Switzerland’s Leibstadt nuclear power plant, said he believed Japanese authorities would be able to manage the situation at the damaged Fukushima facility north of Tokyo.

Engel was an external member of a team sent by the International Atomic Energy Agency (IAEA) to Japan after a 2007 earthquake that hit the Kashiwazaki-Kariwa plant, until then the largest to affect a nuclear complex.

“I think nobody can say at this time whether there is a small melting of any fuel elements or something like that. You have to inspect it afterwards,” he told Reuters by phone.

But a partial meltdown “is not a disaster” and a complete meltdown is not likely, he said, suggesting he believed Japanese authorities were succeeding in cooling down the reactors even though the systems for doing this failed after the quake hit.

“I only see they are trying to cool the reactor, that is the main task, and they are trying to get cooling water from the sea,” Engel said, stressing he did not have first-hand information about events at the Fukushima facility.

Let us hope that they are right.

Global Warning

Monday, January 17th, 2011

People hear climate change through different concerns. Some hear threats to the environment, others to people, and others still to national security. (Of course, there is overlap.)

For those in the national security category, the National Security Journalism Initiative has created Global Warning.

Water shortages in Yemen

Go to A Complex Climate Threat and click on water management—Morocco spends more than 1/5 of its budget on water management, and Sana’a could run out of water in 2025.

 Pakistan floods 2010
Pakistan floods 2010

Click on flooding:

Last summer, record floods ravaged Pakistan, killing nearly 2,000 people, damaging or destroying 1.2 million homes and laying waste to large portions of farmland. Afterward, 34 percent of the rice crop was gone and cholera swept through camps, affecting tens of thousands of people.

During previous disasters in unstable regions — the 2004 tsunami in Southeast Asia, the 1998-2000 drought in Central Asia — terrorist groups stepped in where governments failed, winning supporters with their aid. There were reports of such efforts following the Pakistan floods.

Click on energy shifts:

Since the Industrial Revolution, economic growth has been propelled by fossil fuel emissions. Switching to alternative fuels would change the foundation of the global economy.

While higher energy prices would give major oil exporters resources to increase their power, a shift away from fossil fuels could force changes in petro-regimes. The National Intelligence Council predicts Saudi Arabia, which would absorb the biggest shock, would face new pressures to institute major economic reforms, including women’s full participation in the economy.

Click on international trade:

Climate change stands to disrupt global markets, alter key trading routes and affect natural resource supplies.

After more than one-third of Russia’s grain crop was destroyed last summer by a devastating heat wave and fires — extreme weather events that President Dmitry Medvedev called “evidence of this global climate change” — the country banned all grain exports until the end of the year, causing a price spike in global markets. Less than a week later, food riots broke out in Mozambique.

Go here for videos on threats from climate change to California agriculture, NYC, and Houston energy infrastructure.

Recent articles include

Our man in the greenhouse: Why the CIA is spying on a changing climate

This summer, as torrential rains flooded Pakistan, a veteran intelligence analyst named Larry watched closely from his desk at CIA headquarters just outside the capital.

For Larry, head of the CIA’s year-old Center on Climate Change and National Security, the worst natural disaster in Pakistan’s history is a warning.

“It has the exact same symptoms you would see for future climate change events, and we’re expecting to see more of them,” Larry, who asked his last name not be used for security reasons, said in a recent interview at the CIA. “We wanted to know: What are the conditions that lead to a situation like the Pakistan flooding? What are the important things for water flows, food security, [displaced people], radicalization, disease?”

As intelligence officials assess key components of state stability like these, they are realizing that the norms they had been operating with — like predictable river flows and crop yields — are shifting.

But the U.S. government is ill-prepared to act on changes that are coming faster than anticipated and threaten to bring instability to places of U.S. national interest, according to interviews with several dozen current and former officials and outside experts, and a review of two decades’ worth of government reports. Climate projections lack critical detail, they say, and information about how people react to changes — for instance, by migrating — is sparse. Military brass say they don’t yet have the intelligence they need in order to act.

Drying Peru
Losing the Andes glaciers

Glacier melt hasn’t caused a national crisis in Peru, yet. But high in the Andes, rising temperatures and changes in water supply have decimated crops, killed fish stocks and forced entire villages to question how they will survive for another generation.

U.S. officials are watching closely because without quick intervention, they say, the South American nation could become an unfortunate case study in how climate change can destabilize a strategically important region and, in turn, create conditions that pose a national security threat to Americans thousands of miles away.

Think what it would be like if the Andes glaciers were gone and we had millions and millions of hungry and thirsty Southern neighbors,” said former CIA Director R. James Woolsey. “It would not be an easy thing to deal with.”

Glaciers in the South American Andes are melting faster than many scientists predicted, causing a dramatic change in the region’s availability of water for drinking, irrigation and electricity. Some climate change experts estimate entire glaciers will disappear in 10 years due to rising global temperatures, threatening to create instability across the globe long before their ultimate demise.

Oil rig damaged by Ike

Houston oil infrastructure exposed to storms

The largest search and rescue operation in U.S. history; the largest Texas evacuation ever; a $30 billion price tag and 112 deaths in the U.S….And Ike was only a Category 2 storm with mild-for-a-hurricane winds of 109 mph.

If Ike had been a direct hit on the channel, refineries would have been flooded with seawater despite 16-foot fortifications, likely requiring months of repairs and prolonging supply disruptions, according to analysis by the Severe Storm Prediction, Education and Evacuation from Disasters Center at Rice University.

Not only is the sea level rising, the land is sinking.

Disease: A top U.S. security threat

One of the most worrisome national security threats of climate change is the increased spread of disease, with potentially millions of people at risk of serious illness or death and vast numbers of animals and crops also in danger of being wiped out, U.S. intelligence and health officials say.

But more than a decade after such concerns were first raised by U.S. intelligence agencies, significant gaps remain in the health surveillance and response network—not just in developing nations, but in the United States as well, according to those officials and a review of federal documents and reports.

And those gaps, they say, undermine the ability of the U.S. and world health officials to respond to disease outbreaks before they become national security threats.

U.S. military grasps effects of the rising tide

Climate change is fast becoming one of those security threats, according to U.S. and Bangladeshi officials, who have concluded it will help create new conflict hotspots around the world and heighten the tensions in existing ones—and impact the national security of the United States in the process. Moreover, climate change could overstress the U.S. military by creating frequent and intensified disasters and humanitarian crises to which it would have to respond.

Nowhere is that potential chain of events more worrisome than in Bangladesh, a country strategically sandwiched between rising superpowers China and India, and which also acts as a bridge between South Asia and South East Asia.

Already, Bangladesh is beset by extreme poverty, overcrowding and flooding that frequently render large numbers of people homeless. The Muslim-majority country also has had problems with Islamist radicalization.

And over the next two generations, those problems are expected to get worse due to climate change, which worsens other problems such as food and water scarcity, extreme weather and rising seas, according to interviews with current and former officials and experts. By 2050, rising sea waters are projected to cost the low-lying country about 17 to 20 percent of its land mass, rendering at least 20 million people homeless and decimating food production of rice and wheat, according to the United Nations Intergovernmental Panel on Climate Change. By then, its population is projected to reach more than 200 million, which could lead to internal societal unrest that spills over into neighboring India.

Dirty Coal, Clean Future

Saturday, January 15th, 2011

coal
coal miner

Mining coal is notoriously dangerous, the remnants of those mines disfigure the Earth, and the by-products of coal’s combustion fill the air not simply with soot, smoke, and carbon dioxide but also with toxic heavy metals like mercury and lead, plus corrosive oxides of nitrogen and sulfur, among other pollutants. When I visited coal towns in China’s Shandong and Shanxi provinces, my face, arms, and hands would be rimed in black by the end of each day—even when I hadn’t gone near a mine. People in those towns, like their predecessors in industrial-age Europe and America, have the same black coating on their throats and lungs, of course. When I have traveled at low altitude in small airplanes above America’s active coal-mining regions—West Virginia and Kentucky in the East, Wyoming and its neighbors in the Great Basin region of the West—I’ve seen the huge scars left by “mountain top removal” and open-pit mining for coal, which are usually invisible from the road and harder to identify from six miles up in an airliner. Compared with most other fossil-fuel sources of energy, coal is inherently worse from a carbon-footprint perspective, since its hydrogen atoms come bound with more carbon atoms, meaning that coal starts with a higher carbon-to-hydrogen ratio than oil, natural gas, or other hydrocarbons.

Shanxi
Shanxi

James Fallows, in his The Atlantic article, Dirty Coal, Clean Future, is not oblivious to coal’s faults, and he explains in some depth about coal’s rather large percentage of carbon dioxide emissions. Unfortunately, the scale of the climate change problem is huge:

As one climate scientist put it to me, “To stabilize the CO2 concentration in the atmosphere, the whole world on average would need to get down to the Kenya level”—a 96 percent reduction for the United States. The figures also suggest the diplomatic challenges for American negotiators in recommending that other countries, including those with hundreds of millions in poverty, forgo the energy-intensive path toward wealth that the United States has traveled for so many years.

The reduction needed is even more than 96% when we add in a portion of greenhouse gas emissions from China, where half of electricity is used to manufacture for export. Unfortunately, we will use coal in the future, a lot:

Precisely because coal already plays such a major role in world power supplies, basic math means that it will inescapably do so for a very long time. For instance: through the past decade, the United States has talked about, passed regulations in favor of, and made technological breakthroughs in all fields of renewable energy. Between 1995 and 2008, the amount of electricity coming from solar power rose by two-thirds in the United States, and wind-generated electricity went up more than 15-fold. Yet over those same years, the amount of electricity generated by coal went up much faster, in absolute terms, than electricity generated from any other source. The journalist Robert Bryce has drawn on U.S. government figures to show that between 1995 and 2008, “the absolute increase in total electricity produced by coal was about 5.8 times as great as the increase from wind and 823 times as great as the increase from solar”—and this during the dawn of the green-energy era in America. Power generated by the wind and sun increased significantly in America last year; but power generated by coal increased more than seven times as much… Similar patterns apply even more starkly in China. Other sources of power are growing faster in relative terms, but year by year the most dramatic increase is in China’s use of coal.

storing carbon dioxide

The price of making coal clean, capturing and storing the carbon dioxide, includes a huge energy cost, perhaps 30% increase or more to make the same amount of electricity.

“When people like me look for funding for carbon capture, the financial community asks, ‘Why should we do that now?’” an executive of a major American electric utility told me. “If there were a price on carbon”—a tax on carbon-dioxide emissions—“you could plug in, say, a loss of $30 to $50 per ton, and build a business case.”

Looking at US policy in isolation, there is little reason for optimism, as utilities are refusing to ask ratepayers to pay an extra 3 – 5 cent/kWh for coal. Looking at the US and China together, though…

Ming Sung
Ming Sung from the Clean Air Task Force and

Julio Friedmann
Julio Friedmann from Lawrence Livermore National Laboratory

In the normal manufacturing supply chain—Apple creating computers, Walmart outsourcing clothes and toys—the United States provides branding, design, and a major market for products, while China supplies labor, machines, and the ability to turn concepts into products at very high speed.

But there is more cooperation with coal:

In the search for “progress on coal,” like other forms of energy research and development, China is now the Google, the Intel, the General Motors and Ford of their heyday—the place where the doing occurs, and thus the learning by doing as well. “They are doing so much so fast that their learning curve is at an inflection that simply could not be matched in the United States,” David Mohler of Duke Energy told me.

“In America, it takes a decade to get a permit for a plant,” a U.S. government official who works in China said. “Here, they build the whole thing in 21 months. To me, it’s all about accelerating our way to the right technologies, which will be much slower without the Chinese.

“You can think of China as a huge laboratory for deploying technology,” the official added. “The energy demand is going like this”—his hand mimicked an airplane taking off—“and they need to build new capacity all the time. They can go from concept to deployment in half the time we can, sometimes a third. We have some advanced ideas. They have the capability to deploy it very quickly. That is where the partnership works.”

The good aspects of this partnership have unfolded at a quickening pace over the past decade, through a surprisingly subtle and complex web of connections among private, governmental, and academic institutions in both countries. Perhaps I should say unsurprisingly, since the relationships among American and Chinese organizations in the energy field in some ways resemble the manufacturing supply chains that connect factories in China with designers, inventors, and customers in the United States and elsewhere. The difference in this case is how much faster the strategic advantage seems to be shifting to the Chinese side.

Take home point: We need to add a cost to greenhouse gas emissions in the United States and elsewhere in the $30 – 50 range if we are to stop using coal without carbon capture and storage.

Another New Yorker article: Jevons Paradox— Does Improving Efficiency Do Any Good?

Monday, January 3rd, 2011

The New Yorker has done much to introduce non-scientists to scientific thinking (eg, Kolbert’s articles on climate change), but now aims to confuse us, or so it appears, by presenting real concerns in a too simplistic manner. David Owen’s recent article discusses Jevons Paradox in The Efficiency Dilemma has been attacked by critics who object to his omissions. Truth sometimes lies in the middle, but in this case, Truth appears to be more towards the extremes, with a caveat, it depends on where and for what.

Jevons pointed out a century and a half ago that increased efficiency can lead to lower prices and thus to consumption greater than if there had been no improvement. Rebound effect is the term used when increased efficiency leads to lower consumption, but the decrease is made smaller by behavior change.

From the article:
• Consumption increases as costs go down. Because refrigerators are so much cheaper to operate, Owen says, they have spread to hotel rooms and gas stations. Additional energy loss (and increases in greenhouse gas emissions) occur as we increase the amount of food we buy and waste (and consume) as refrigerator size increases. Altogether, per capita energy consumption due to all these changes has presumably grown even as energy to power residential refrigerators has gone down. Other examples are the rapid increase in air conditioning and the size of (and number of) houses in the South, and increases in lighting use in the US so “that darkness itself is spoken of an endangered natural resource”—increases in efficiency mean that the typical person uses more energy for both lighting and air conditioning.
• Increased efficiency in automobiles has been devoted to increasing horsepower and weight rather than fuel economy.
• Decreases in cost increases both the number of car owners and the number of vehicle miles traveled per car per year.

Changing energy use in refrigerators

The Jevons Paradox is still considered a factor in many parts of the world. For example, the introduction of cheap, efficient cars to India (the Nano) was expected to lead to increased consumption of oil. (Between March 2009 and January 2011, some 1 million cars were sold—see here for some reasons why the Nano hasn’t taken off, although this may still happen). Cheap solar panels (expensive compared to prices paid where there is a reliable grid, but cheap relative to the cost of a long ride in a motorcycle taxi to recharge the phone) and efficient light bulbs in Africa also lead to increased energy use, but a low-greenhouse gas form. There is great enthusiasm about the latter, but I have yet to hear policy experts wax enthusiastic about the Nano. The policy community appreciates the need to make more energy available to the poor. However, the need for more cars is either less clear than needs for phones and lightbulbs, or the downsides of adding more photovoltaics are smaller than the problems of using more oil, of which climate change is just one.

increased energy use in Kiptusuri
Increased energy use in Kiptusuri, Kenya

Of course, oil use is increasing in India anyway, as Indians become wealthier. Owen fails to discuss the effects of increased wealth on people’s choices, a fairly large omission, so would attribute the increase solely to the more efficient automobiles. (Nor does Owens consider the time for stock turnover.)

The rebound effects in 21st century US are of a different scale than the examples above. We already leave our lights on. A lot. We own considerably more than one car per licensed driver, 842 cars/1000 people (compared to 12/1000 in India). So it’s unlikely that the introduction of more efficient cars will lead to as dramatic an increase in fuel use as in India. Or that more efficient bulbs will produce the increase in lighting now being seen in Kiptusuri.

According to Effectiveness and Impact of Corporate Average Fuel Economy (CAFE) Standards, CAFE standards appear to have a 10 – 20% rebound effect, while changes in Europe produce a rebound effect of 20 – 30% (the difference is due to those shifting from public transit).

The rebound effect for cars today in the US may be greater than for refrigerators, now that the market for refrigerators is apparently saturated. (I’ve heard people in policy wonder when the US will reach saturation for automobiles—there has to be a point at which nothing can push Americans to drive more.)

There are three causes for the rebound effect, according to Energy Efficiency and the Rebound Effect: Does Increasing Efficiency Decrease Demand? (pdf)

Direct Effects – The consumer chooses to use more of the resource instead of realizing the energy cost savings. For example, a person with a more efficient home heater may chose to raise the setting on the thermostat or a person driving a more efficient car may drive more. This effect is limited since a person will only set the thermostat so high or have so many hours to spend driving.

Indirect Effects – The consumer chooses to spend the money saved by buying other goods which use the same resource. For example, a person whose electric bill decreases due to a more efficient air conditioner may use the savings to buy more electronic goods.

Market or Dynamic Effects
– Decreased demand for a resource leads to a lower resource price, making new uses economically viable. For example, residential electricity was initially used mainly for lighting, but as the price dropped many new electric devices became common. This is the most difficult aspect of the rebound effect to predict and to measure.

See the paper for the scale of the rebound effect, which is close to 0% for home appliances, 10 – 30% for cars, and 0 – 50% for space cooling.

Even advocates of energy efficiency see a need to do more. In Leaping the Energy Gap (subscription required), Dan Charles says,

Experience has shown that there is more to saving energy than designing better light bulbs and refrigerators. Researchers say it will need a mixture of persuasion, regulation, and taxation.

(August 14, 2009 Science)

A frequently touted statistic is that while per capita US electricity use increased 40% over the last 3 decades, it remained flat in California. Some credit the efficiency mandates in California. That appears to be true only in part:

Anant Sudarshan and James Sweeney of Stanford University’s Precourt Energy Efficiency Center (PEEC) recently calculated that the state’s energy policies can take credit for only a quarter of California’s lower per capita electricity use. The rest is due to “structural factors” such as mild weather, increasing urbanization, larger numbers of people in each household, and high prices for energy and land that drove heavy industry out of the state.

Art Rosenfeld
Art Rosenfeld

An old economic assumption is that if scientists add efficiency, the consumer will come.

[Art] Rosenfeld [who was the most important person pushing California’s push toward higher efficiency] and Edward Vine had a friendly, long-running argument during their 2 decades as colleagues at [Lawrence Berkeley National Laboratory]. Rosenfeld believed in technology. When he testified before the U.S. Congress, as he did frequently in the early 1980s, he always came with props in hand: compact fluorescent light bulbs, heat-shielding windows, or computer programs for predicting the energy use of new buildings. But Vine, whose Ph.D. is in human ecology, wasn’t convinced of technology’s power. “We can’t assume, if we have a great technology, that people will rush to stores and buy it,” Vine says. “We need to find out how people behave, how they make decisions, how they use energy, and we need to work with them.”

For the most part, energy-efficiency programs around the country have followed Rosenfeld’s line. They offer financial incentives for adopting energy-saving, cost-effective technology, and trust that consumers will follow their economic self-interest.

Yet many researchers are now coming around to Vine’s point of view. Consumers don’t seem to act like fully informed, rational decision-makers when they make energy choices. Many avoid making choices at all. Give them a programmable thermostat, and they won’t program it. Offer them an efficient light bulb that pays for itself in 2 years, and they won’t buy it.

Some points made by the article:
• The goal is to decrease energy use per person—stable energy use is not enough.
• Even for-profit companies don’t realize how much money can be saved on energy [and companies do much better than individuals].
• In a crisis, people respond to a need for “good citizens”. Some percentage of that change in behavior remains after the crisis ends.
• We see waste in others reflecting their “inner characters” and “own wasteful practices as the product of circumstances”, so information about the need rarely helps.
• Role models do help.
• We care what others are doing. Sacramento Municipal Utility District included information with the bills about how one’s energy use compares to one’s neighbors, and energy use declined 2%. [Information about saving energy left on your door knob is ineffective if accompanied by the importance of saving money or saving the earth, but is effective if we are told that our neighbors are doing it.]
• The current market option, more efficient and more expensive appliances targeting high-end customers, is less effective than selling these appliances at Costco or Walmart.
• Social marketing works, at least in some places, such as Hood River, OR, where 85% of the homes got energy audits and free efficiency upgrades.

[Hugh] Peach compared the process to a political campaign. The utility sat down with local leaders, followed their advice, and relied heavily on local volunteers. The process was time-consuming and labor-intensive but, Peach says, a pleasure. There was “a lot of community spirit. People just saw it as the right thing to do.”

• Feedback helps, eg, the Prius dashboard showing car drivers their rate of energy use. There is hope that Smart Meters will lead consumers to reduce energy use in their home, first by cutting use, eventually shifting to more efficient appliances.
• Green buildings don’t do nearly as well as advertised, and architects get too little feedback on how energy use changes as a result of their work. In a response to this article, several examples are given for projects where actual energy use came in at least double predicted energy use.
• There are a number of perverse incentives: people away from home have little incentive to reduce energy and water use. Landlords have little incentive to purchase more expensive more efficient appliances. Cable services provide boxes which use 40 W 24 hours/day and have no incentive to spend a tad more on reducing energy use. These perverse incentives might be responsible for 1/4 of US residential energy use. In Japan, on the other hand, vending machine suppliers pay for the electricity, and vending machines are more efficient.
• Really, adding a cost to energy is necessary, because we need to see the cost of our behavior, which goes beyond the price we pay today for energy.

In Behavior and Energy Policy, (subscription required, March 5, 2010 Science), there is more discussion of how to combine greater energy efficiency with changed behavior.

Summary: Jevons Paradox appears more important in less saturated markets and other factors, such as increased wealth should be considered. Increased efficiency does reduce energy use in the US, but if our goal is to mitigate greenhouse gas emissions quickly enough, we may want to move to “mixture of persuasion, regulation, and taxation.”

Comments from others: See The National Geographic blog for the comments of James Barrett (Clean Economy Development Center) and Matthew Kahn (UCLA)

Recent Article in the New Yorker, Is There Something Wrong with the Scientific Method?

Saturday, January 1st, 2011

In an attempt to point out that not every article that makes it into peer review survives the scrutiny of the science community, New Yorker author Jonah Lehrer apparently goes a little further than he intended, and says so here. The Truth Wears Off begins with a number of examples of when the effects described in peer reviewed articles don’t seem to be real, notably in medicine, the life sciences, and psychology. Lehrer gives some examples from physics, as well.

To some, it appears that the effect first seen declines over time. Examples:

• people shown a face and asked to describe it showed a lower ability to recognize the face (verbal overshadowing) two decades ago, but the effect shrank dramatically year after year.

• Anti-psychotic drugs tested in the 1990s appear to be less effective today. Note: the article leaves unexplained whether the schizophrenics in this study are similar to schizophrenics studied a decade ago—this includes severity of and type of symptoms, and any other treatments they may have received.

• In an ESP test from early last century, some initially appeared to show paranormal ability, but further tests failed to substantiate this result.

• A purported correlation between female barn swallows and symmetry in their mates led to a number of studies finding similar results for swallows and other species, but the correlation has since disappeared. Michael Jennions found that a large number of results in ecology and evolutionary biology demonstrate this decline effect.

In an apparent misunderstanding of the process, Lehrer discusses the problem when “rigorously validated findings” can no longer be replicated as a problem with science. Most scientists would assume there is a problem with both the findings and the sloppiness that leads to a large number of poor results.

Lehrer then discusses a few problems in the article, but does not tease out the importance of each:

• Journals and scientists look for results that disagree with the orthodoxy. Scientists are less likely to submit null results to journals and journals are less likely to print them. Once the orthodoxy changes (from symmetry is irrelevant to symmetry is important to female barn swallows), confounding results become interesting. Note: This is considered a real phenomenon, but Lehrer gives little idea as to whether this is a problem with 0.5% or 95% of articles submitted. Climate change skeptics—if results are submitted to peer review which are contrary to scientific orthodoxy on climate change, these results will get prominent play, if they make it through peer review.

• The barn swallow studies were not double blind studies, with different people measuring feather length and assessing behavior. When it came time to round up or down, errors crept into measurements that differed by millimeters. Similarly, published acupuncture results vary by country, in part because the person testing for the effect knows whether acupuncture has been used.

• A number of studies, such as those finding genetic effects on hypertension and schizophrenia, were so badly done that the results are meaningless. One review of 432 such results found the vast majority worthless. Note: This is considered an important problem in some fields of science, notably medicine, and also my field, education. See comments below for what those in the life sciences and medicine think. There appears to be little support for Lehrer’s including physics experiments in his article.

• Lehrer assumes that all the later-refuted results were analyzed statistically in an appropriate way. Note: Statisticians do not, see Andrew Gelman’s comment below.

Are there reasons that explain these results besides the one favored by many, that science is a crapshoot? The person who told me of this article certainly feels that way; he picks and chooses among scientific results, except when he knows scientists are wrong and so goes with other analysis.

Lehrer says, “We like to pretend that our experiments define the truth for us. But that’s often not the case. Just because an idea is true doesn’t mean it can be proved. And just because an idea can be proved doesn’t mean it’s true. When the experiments are done, we still have to choose what to believe.” Only science doesn’t prove so much as disprove, and what is left standing gains credibility.

Lehrer does not provide enough information or context so that we can make sense of what he says. He repeats what everyone in science already knows: that research in some fields, and some peer review, is of lower quality, and that while a number of peer review results turn out to be uninteresting, this is much more often true in medicine and some of the life sciences. The one important point I got from the article, that results that no longer appear to be true are still used by some doctors, disappears among the noise.

Not mentioned is that people whose exposure to science comes primarily from articles on medicine see reason to doubt medical science, and many extrapolate to other fields of science. Those who prefer to doubt science will find justification in this article.

Comments from others
Jerry Coyne believes that his field, evolutionary biology, has a problem, in part because not many eyes look at each result.

I tend to agree with Lehrer about studies in my own field of evolutionary biology. Almost no findings are replicated, there’s a premium on publishing positive results, and, unlike some other areas, findings in evolutionary biology don’t necessarily build on each other: workers usually don’t have to repeat other people’s work as a basis for their own. (I’m speaking here mostly of experimental work, not things like studies of transitional fossils.) Ditto for ecology. Yet that doesn’t mean that everything is arbitrary. I’m pretty sure, for instance, that the reason why male interspecific hybrids in Drosophila are sterile while females aren’t (“Haldane’s rule”) reflects genes whose effects on hybrid sterility are recessive. That’s been demonstrated by several workers. And I’m even more sure that humans are more closely related to chimps than to orangutans. Nevertheless, when a single new finding appears, I often find myself wondering if it would stand up if somebody repeated the study, or did it in another species.

But let’s not throw out the baby with the bathwater. In many fields, especially physics, chemistry, and molecular biology, workers regularly repeat the results of others, since progress in their own work demands it. The material basis of heredity, for example, is DNA, a double helix whose sequence of nucleotide bases codes (in a triplet code) for proteins. We’re beginning to learn the intricate ways that genes are regulated in organisms. The material basis of heredity and development is not something we “choose” to believe: it’s something that’s been forced on us by repeated findings of many scientists. This is true for physics and chemistry as well, despite Lehrer’s suggestion that “the law of gravity hasn’t always been perfect at predicting real-world phenomena.”

Lehrer, like Gould in his book The Mismeasure of Man, has done a service by pointing out that scientists are humans after all, and that their drive for reputation—and other nonscientific issues—can affect what they produce or perceive as “truth.” But it’s a mistake to imply that all scientific truth is simply a choice among explanations that aren’t very well supported. We must remember that scientific “truth” means “the best provisional explanation, but one so compelling that you’d have to be a fool not to accept it.” Truth, then, while always provisional, is not necessarily evanescent. To the degree that Lehrer implies otherwise, his article is deeply damaging to science.

[Note: most scientists in physics, chemistry, and molecular biology, so far as I know, agree.]

David Gorski, an advocate of science-based medicine, says that people in medicine have been talking about a number of these issues for years, however, Lehrer goes too far in generalizing poor medical studies into problems with science.

Jennions’ article was entitled Relationships fade with time: a meta-analysis of temporal trends in publication in ecology and evolution. Reading the article, I was actually struck by how relatively small, at least compared to the impression that Lehrer gave in his article, the decline effect in evolutionary biology was found to be in Jennions’ study. Basically, Jennions examined 44 peer-reviewed meta-analyses and analyzed the relationship between effect size and year of publication; the relationship between effect size and sample size; and the relationship between standardized effect size and sample size. To boil it all down, Jennions et al concluded, “On average, there was a small but significant decline in effect size with year of publication. For the original empirical studies there was also a significant decrease in effect size as sample size increased. However, the effect of year of publication remained even after we controlled for sampling effort.” They concluded that publication bias was the “most parsimonious” explanation for this declining effect.

Personally, I’m not sure why Jennions was so reluctant to talk about such things publicly. You’d think from his responses in Lehrer’s interview that scientists would be coming for him with pitchforks, hot tar, and feathers if he dared to point out that effect sizes reported by investigators in his scientific discipline exhibit small declines over the years due to publication bias and the bandwagon effect. Perhaps it’s because he’s not in medicine; after all, we’ve been speaking of such things publicly for a long time. Indeed, we generally expect that most initially promising results, even in randomized trials, will not ultimately pan out. In any case, those of us in medicine who might not have been willing to talk about such phenomena became more than willing after John Ioannidis published his provocatively titled article Why Most Published Research Findings Are False around the time of his study Contradicted and Initially Stronger Effects in Highly Cited Clinical Research. Physicians and scientists are generally aware of the shortcomings of the biomedical literature. Most, but sadly not all of us, know that early findings that haven’t been replicated yet should be viewed with extreme skepticism and that we can become more confident in results the more they are replicated and built upon, particularly if multiple lines of evidence (basic science, clinical trials, epidemiology) all converge on the same answer. The public, on the other hand, tends not to understand this.

Gorski also discusses the effect of subject popularity on calculations of error rates. Commenters look at the challenges Lehrer presents from physical science, and do not support his conclusions.

It’s always good to run your results by someone who is very good at statistics. Andrew Gelman, statistician, says,

The short story is that if you screen for statistical significance when estimating small effects, you will necessarily overestimate the magnitudes of effects, sometimes by a huge amount. I know that Dave Krantz has thought about this issue for awhile; it came up when Francis Tuerlinckx and I wrote our paper on Type S errors, ten years ago.

My current thinking is that most (almost all?) research studies of the sort described by Lehrer should be accompanied by retrospective power analyses, or informative Bayesian inferences. Either of these approaches–whether classical or Bayesian, the key is that they incorporate real prior information, just as is done in a classical prospective power analysis–would, I think, moderate the tendency to overestimate the magnitude of effects.

Note: I don’t understand statistics, or Gelman’s solutions, but I learned early on that poor statistics is the downfall of many a conjecture.

PZ Myers, biologist

Early in any scientific career, one should learn a couple of general rules: science is never about absolute certainty, and the absence of black & white binary results is not evidence against it; you don’t get to choose what you want to believe, but instead only accept provisionally a result; and when you’ve got a positive result, the proper response is not to claim that you’ve proved something, but instead to focus more tightly, scrutinize more strictly, and test, test, test ever more deeply.

Steven Novella, neurologist, discusses how the naive, the skeptical (scientists mostly fit in this category), and the deniers see science, then says,

Lehrer is ultimately referring to aspects of science that skeptics have been pointing out for years (as a way of discerning science from pseudoscience), but Lehrer takes it to the nihilistic conclusion that it is difficult to prove anything, and that ultimately “we still have to choose what to believe.” Bollocks!

John Horgan sees this as the decline of illusion. He is not a big fan of truthiness.

Lehrer’s reference to physics was checked by Charles Petit. He quotes Lawrence Krauss,

“The physics references are (deposit scatological bovine expletive here) … the neutron data have fallen, reflecting under-estimation of errors, but the lower lifetime doesn’t change anything having to do with the model of the neutron, which is well understood and robust … And as for discrepancies with gravity, the deep borehole stuff is interesting but highly suspect. Moreover, all theories conflict with some experiments, because not all experiments are right.” / LMK