Mechanical Engineering magazine’s article, Carbon Loaded, includes a useful graphic to help us sort out GHG emissions.
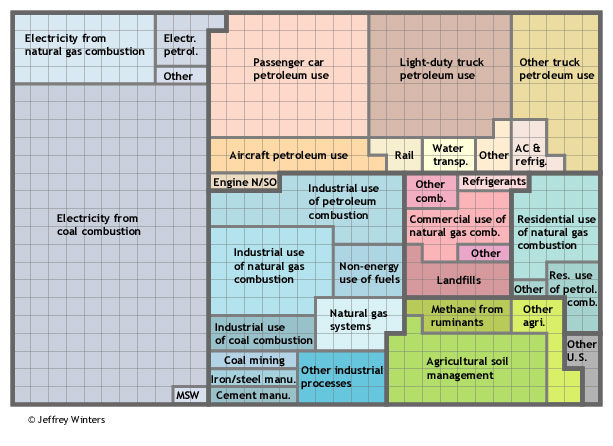
Much thanks to the author for redoing EPA information in an understandable format.
Most of these are increasing, some faster than others.

Great graphic. I didn’t realize how large of a problem coal is already – even before we start the new generation of coal plants.
Crossing off those groups that widespread nuclear (or solar or wind, in theory) plus electric vehicles can remove, we’re left with the green section, refrigerants, non-energy use of fuels, and landfills (ok, also aircraft unless supercapacitors really live up to their potential). These are all problems that have solutions, the only question is if we can respond in time.